Developers and designers

Design squares people want to use

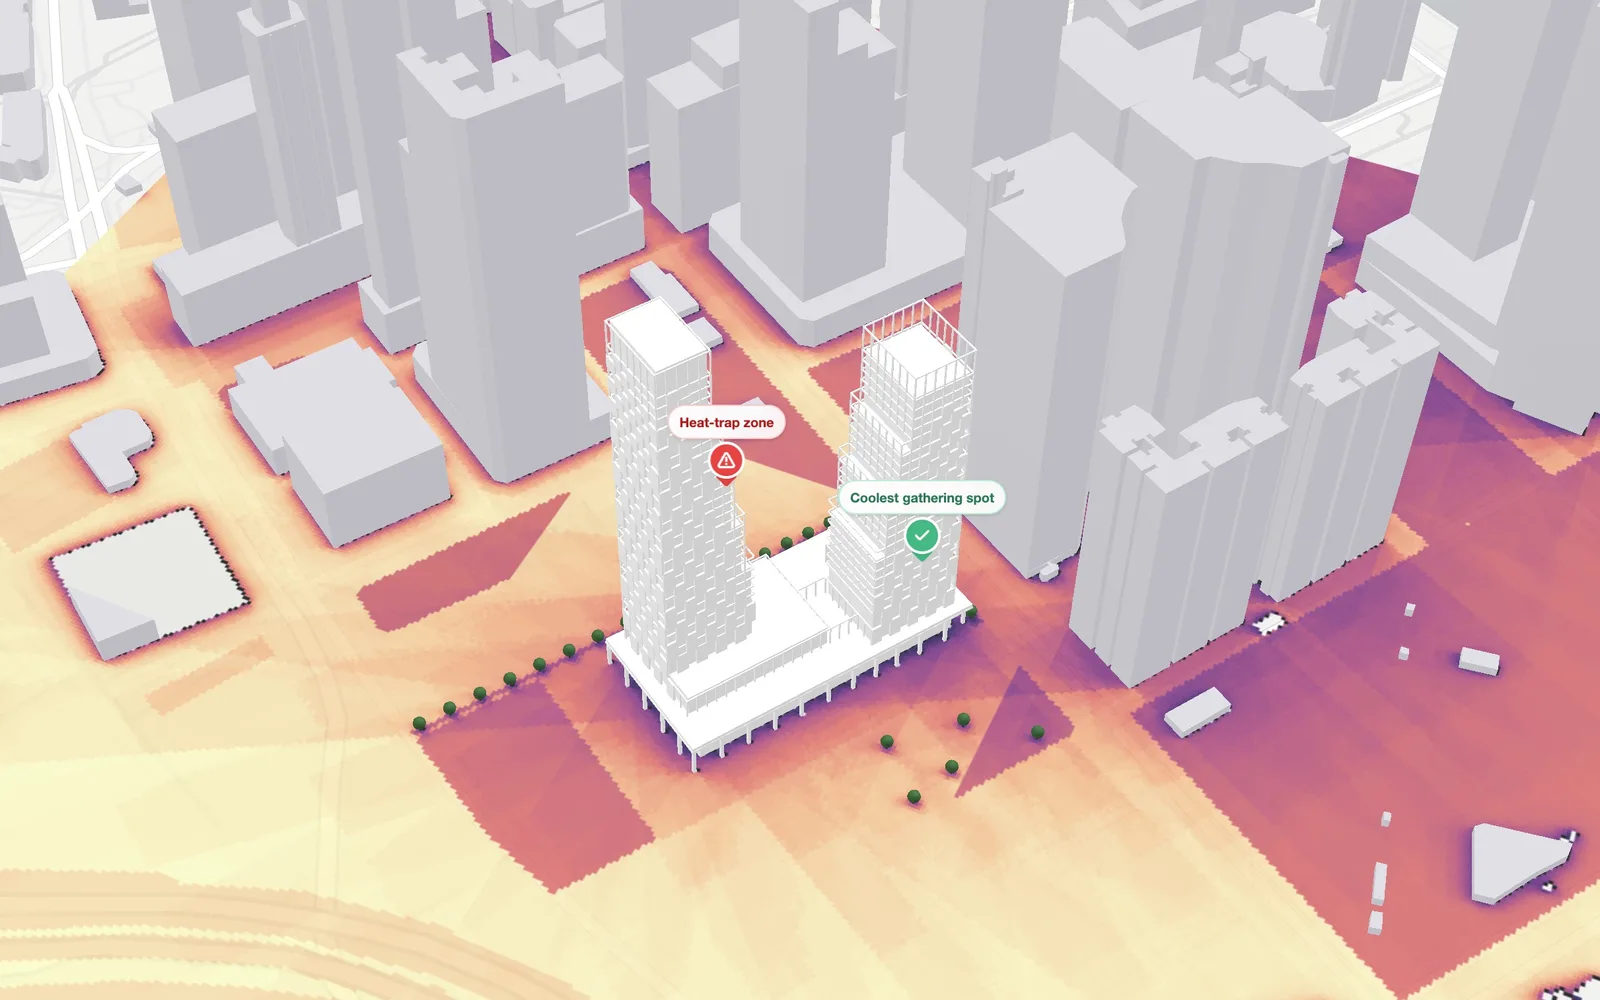
Test cooling measures on a real square in seconds, see the effect and the cost of each, and take only the best mix to a detailed study.

Test trees, shade and surfaces on a real square in seconds, with the cost of each.

Climate adaptation budgets are limited, and a consultant study takes weeks. Dense city areas can be up to 7 °C hotter than their green edges (Cooling Singapore), so the choice of measure matters.

With infrared.city, one person can test trees, shade sails, PV canopies, green facades, grass and cool surfaces on a real square in a day. Each option runs in seconds with the same weather and the same measures, so you compare dozens of variants, including 2050 climate scenarios made by morphing the weather file. Only the best mix goes to a detailed study.

Try the measures yourself in the browser platform, or let consultancies iterate through the API before they start slower, more expensive software.

Design options compared in the browser platform
8
cooling measures tested on one square
−1 K
from 10 trees and 2 shade sails
3x
the cost for the same cooling from a PV canopy

Sources: Cooling Singapore.

Find the cooling measures that work, at the lowest cost, before anyone commissions a study.

Study

Cooling a square in Vienna

MuseumsQuartier courtyard, 4,150 m², 15 July at 15:00, 31 °C air. Eight measures tested: trees cool the square most per euro, light paint and cool pavement make it warmer for people, and a green roof changes nothing at street level.


Funded and supported by

  • NVIDIA Inception Program
  • Microsoft for Startups
  • aws Austria Wirtschaftsservice
  • FFG Austrian Research Promotion Agency
  • Hub71, Abu Dhabi
  • EIT Urban Mobility, co-funded by the European Union
  • D²XCEL, European Innovation Council, funded by the European Union
  • Amazon Web Services
  • Leading Cities

Built on