Study
Testing options on one hotspot
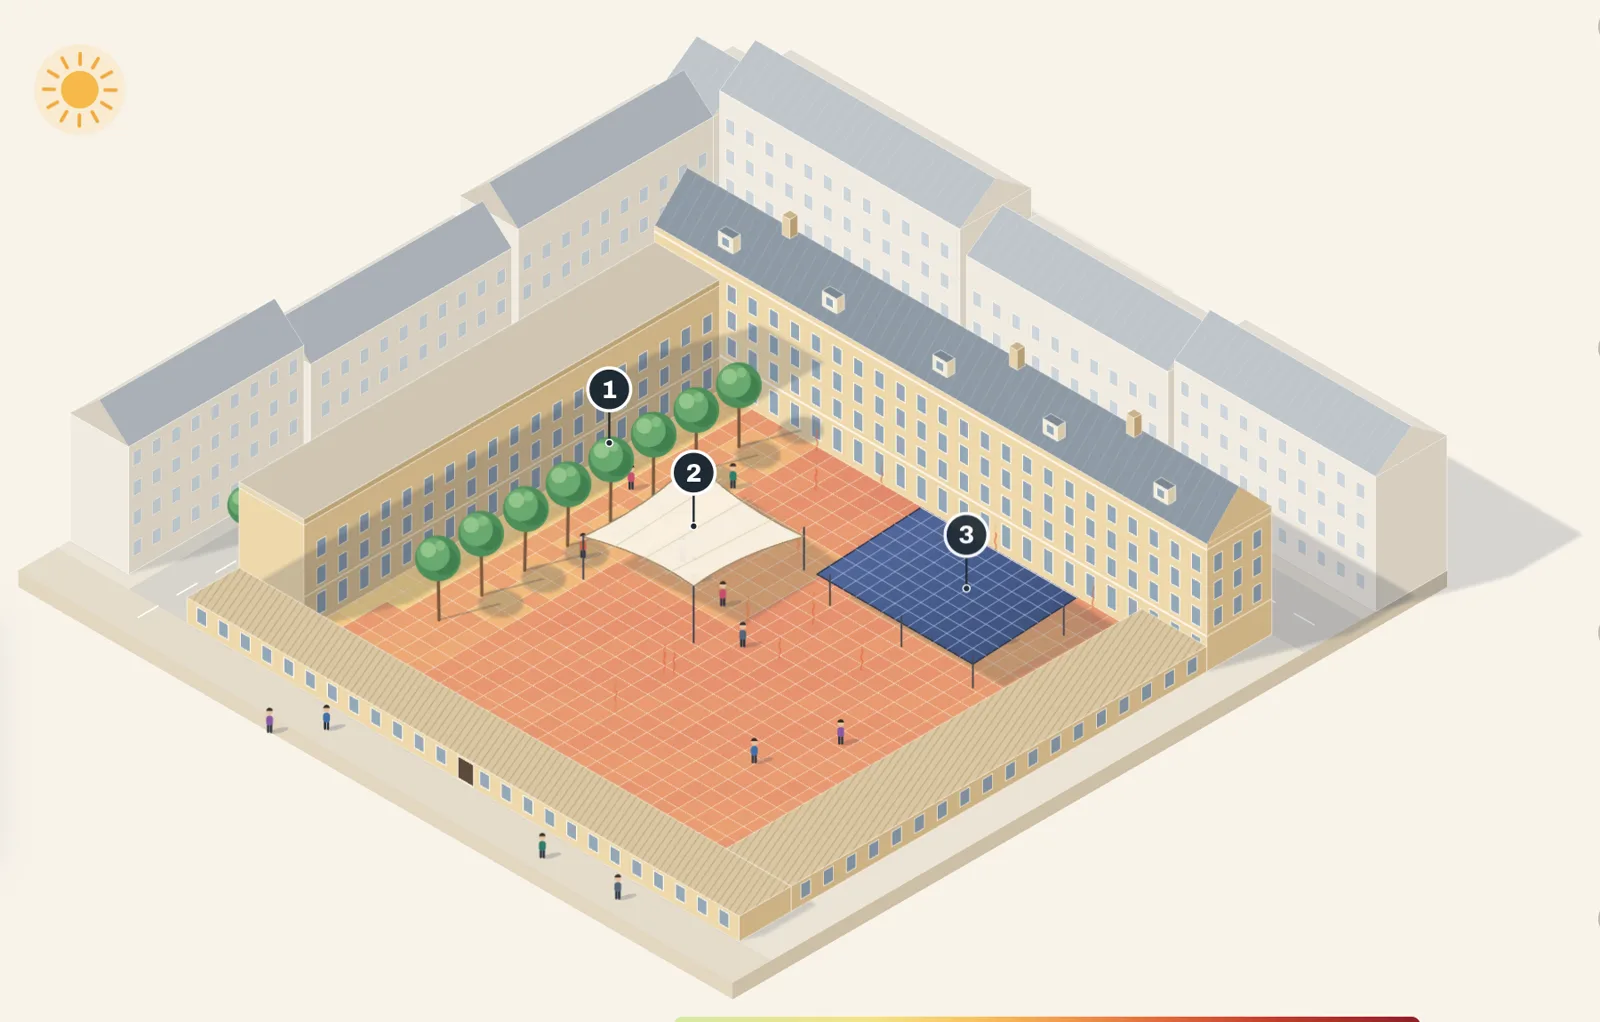
Eight cooling measures on a Vienna courtyard, each with its cooling and its cost. An AI agent found that 10 trees and 2 shade sails cool the whole square by 1 K for about a third of the cost of a PV canopy.
 Platform Book a call
Rank every district by heat stress, test the cooling options on the worst spots, and bring council the cost per degree and the people reached for each budget line.
Rank the city, shortlist hotspots, test options, and show council the cost per degree.
Most cities adapt wherever a project happens to start, and every budget line has to be argued for. Without numbers for the whole city, it is hard to say why one street gets trees before another.
Rank the city. The climate layer models felt heat, wind, shade and sun on all streets, combined with your population data: residents, schools, care homes, bus stops. Shortlist the hotspots. Pick the places where heat stress and exposed people overlap. Test the options. On each hotspot, compare trees, shade sails, canopies and new surfaces by cooling and cost, in seconds. Make the case. A report for council with the ranking, the cost per degree, the people reached and the method.
Starts from your city's live layer, with forecasts and 2050 scenarios.
Test options on any hotspot yourself, in the browser.
For council and funders: ranking, options, cost per degree, people reached and the method.
Your data, your GIS and twin, your process, connected to the same engine.
Every street modelled. Every option costed. Every budget line traceable to a number.
Put the budget where it cools the most people, with the numbers to prove it.
Eight cooling measures on a Vienna courtyard, each with its cooling and its cost. An AI agent found that 10 trees and 2 shade sails cool the whole square by 1 K for about a third of the cost of a PV canopy.
Funded and supported by