
The climate API for your product
Run climate simulations from your own code. Wind, heat, sun and daylight for one site or a whole city.
Docs Playground Get your API key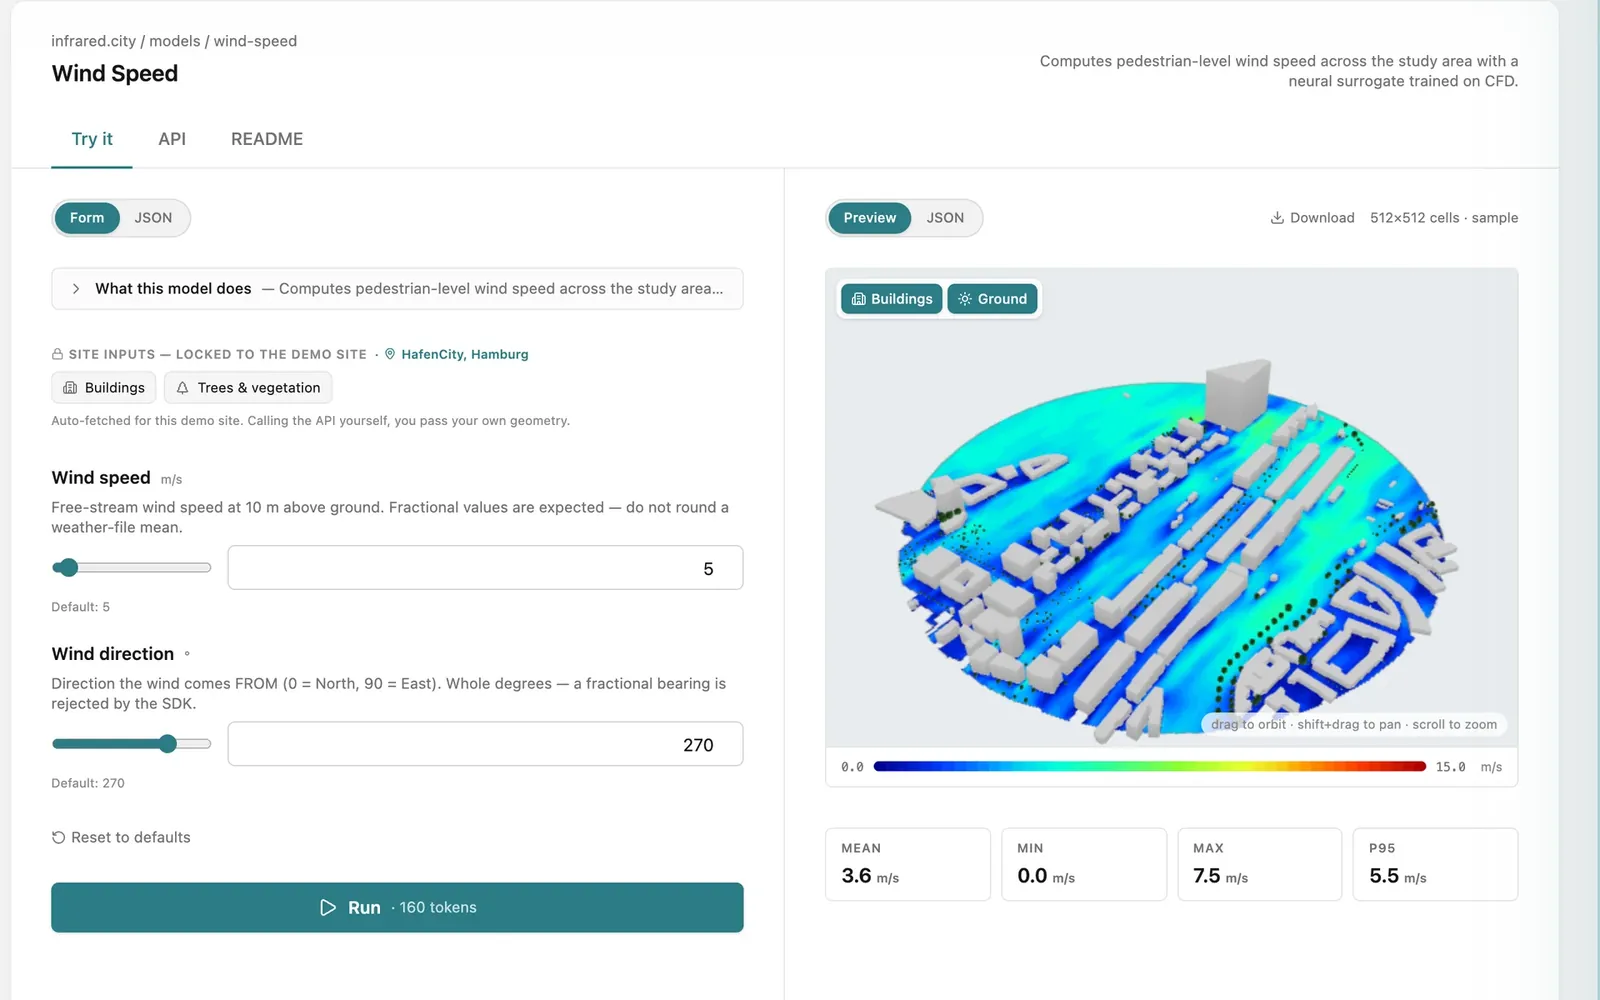
For enterprise and platforms
Built for teams that run it inside their product.
One of the largest AEC software platforms runs our engine, since 2026. More than 2,500 accounts use it.
- Reliable at scaleFailed jobs rerun automatically.
- EU hosting and GDPRFrankfurt, data deleted after 24 h.
- Your termsDPA, OEM licence, SLA.
- On-prem possibleCapacity raised with you.
How does this compare with ENVI-met, SOLWEIG or PALM-4U? See when to use which tool.
Let your AI agent write the code
The skill teaches your coding agent the SDK and its recipes: web apps, 3D facade viewers, Grasshopper, notebooks and secure backends. Your agent runs real simulations with your key and does not invent numbers.
In Claude Code or Cursor
/plugin marketplace add Infrared-city/infrared-skills
/plugin install infrared@infrared-skillsCodex, Copilot, Windsurf: read AGENTS.md .
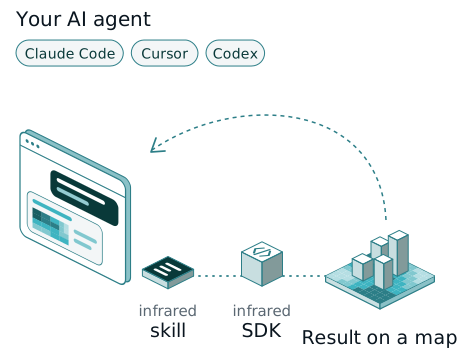
Build me a small web app: I draw an area, press Run, and see thermal comfort on a map.
Build an app in less than an hour
Pick a recipe. Each one is a working example in our public repository; your agent reads it and adapts it to your site, your data and your stack.
- Web app or client portal Draw an area, press Run, see the result on a map.

- 3D facade viewer Sun on every wall and roof, the value on hover.
- Grasshopper script Wind, sun or comfort in Rhino 8, baked into your model.
- Notebooks and batch studies Ten ready notebooks for variants, heat, wind and cost.

- Many users, key kept safe A Worker or a FastAPI backend keeps your key on the server.

- Digital twin with 3D Tiles Your results as 3D Tiles, ready for Cesium.

Built with infrared.city
Our own apps first, then our demos, then what teams built in five days at the infrared.city Buildathon in May 2026. Point at or tap a card for more.
-
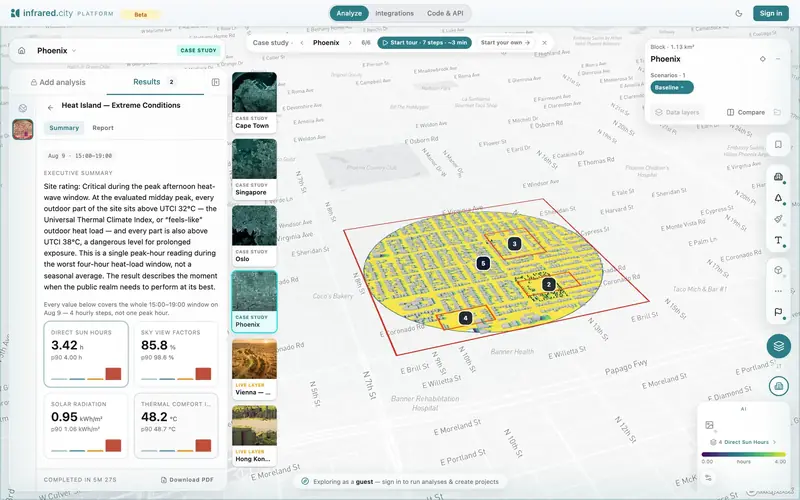 Our app
The infrared.city platform
by infrared.city
Our appThe infrared.city platform
Draw a site, run any model, compare options and share the result.
- Runs on the same engine and API as the SDK
- Look around in guest mode, no sign-up
-
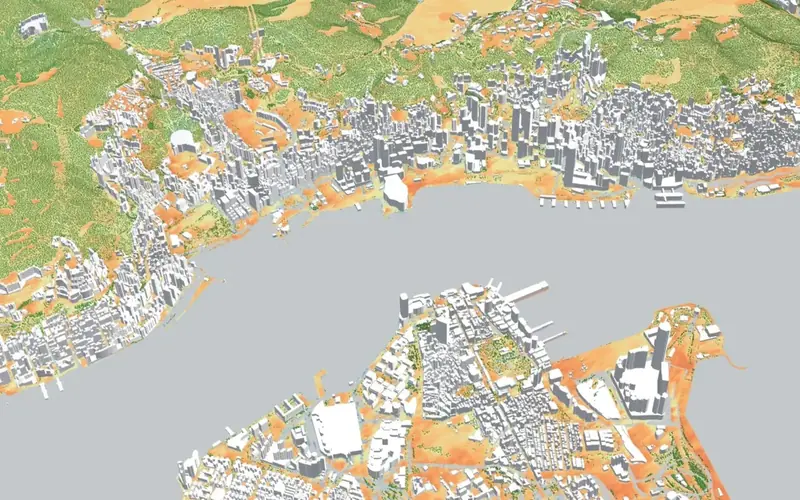 Our app
Hong Kong climate twin
by infrared.city
Our appHong Kong climate twin
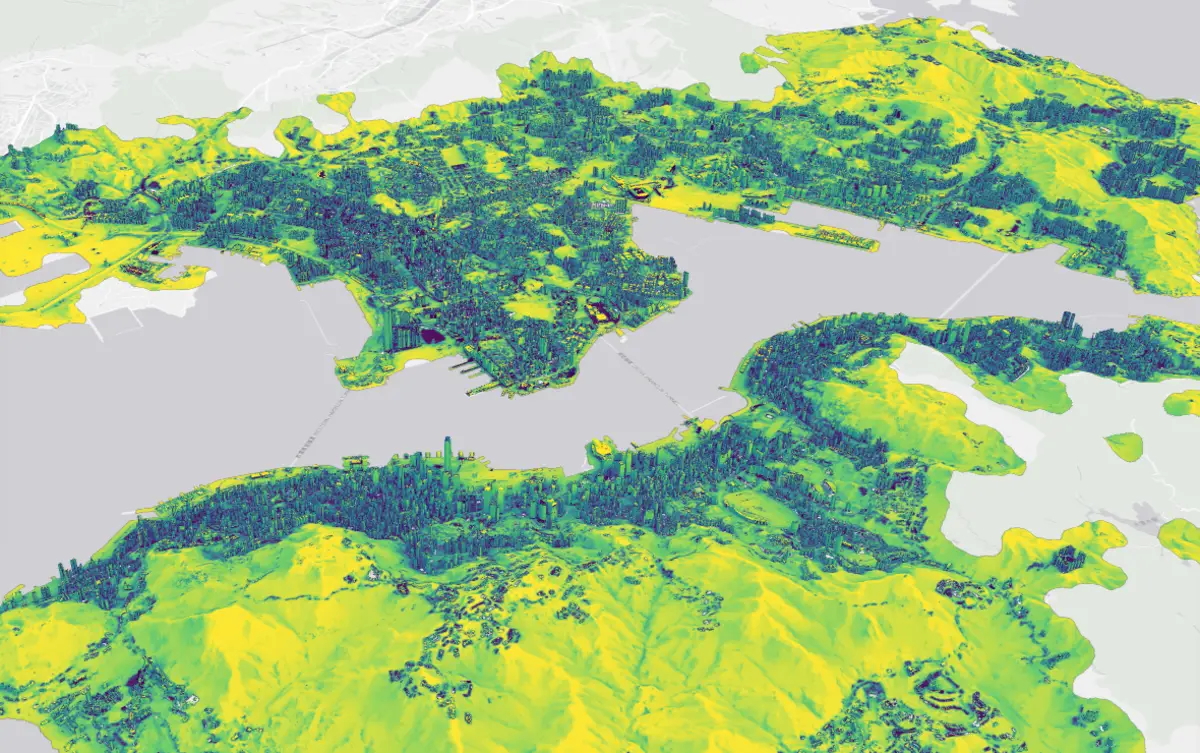
Perceived heat, sun hours and sky view for every street of Hong Kong.
- A live layer, updated every hour
- We prepare your city the same way
-
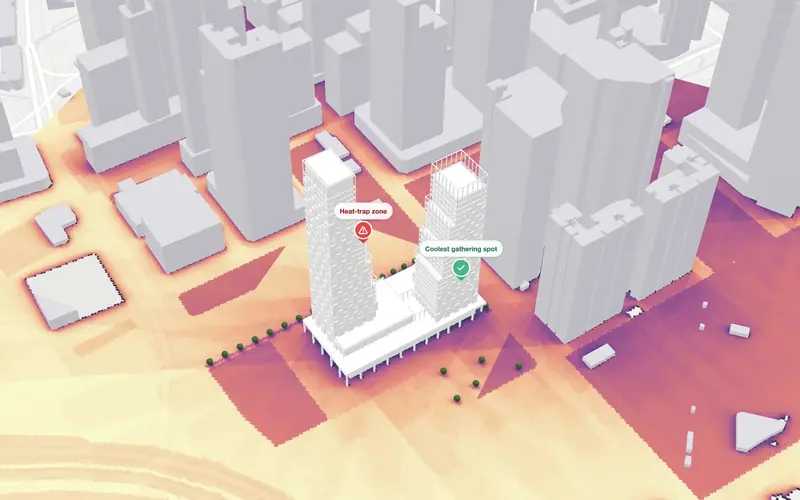 Our demo
Design & compare
by infrared.city
Our demoDesign & compare
Compare building options before you commit.
- Twelve tower designs in Singapore. Compare daylight, sun on the facade and outdoor comfort side by side.
- For design teams and developers
-
 Our demo
Construction heat planning
by infrared.city
Our demoConstruction heat planning
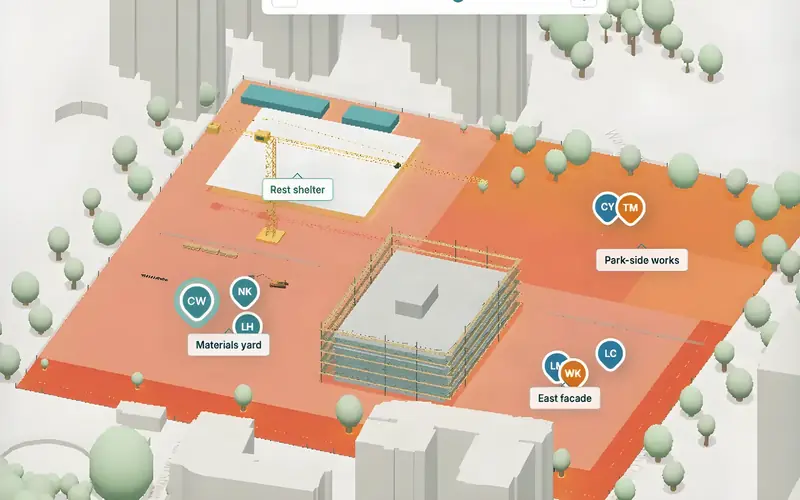
Plan work around local heat exposure.
- Heat exposure for crews in Hong Kong. Test shade, fans and task rotation before you change the work plan.
- For infrastructure and site operators
-
 Our demo
Streets & public spaces
by infrared.city
Our demoStreets & public spaces
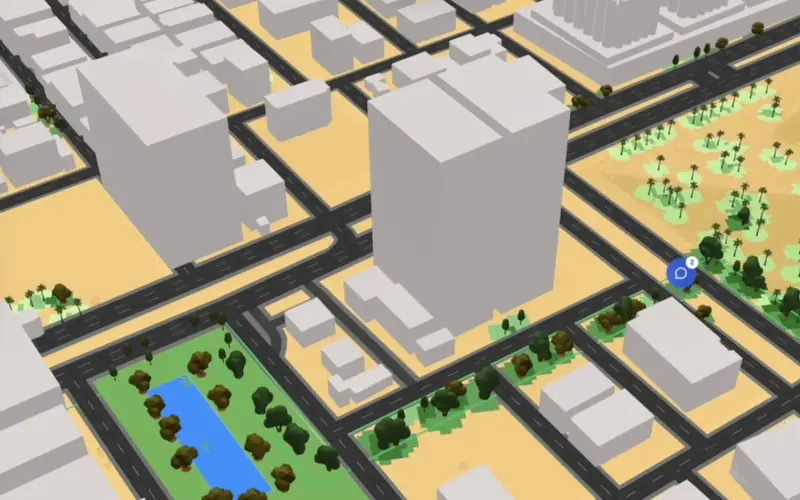
Test trees, shade and surface choices.
- Change trees, shade structures and surfaces along a street. See the effect on outdoor comfort.
- For masterplanners and cities
-
 Our demo
Marathon & event routes
by infrared.city
Our demoMarathon & event routes
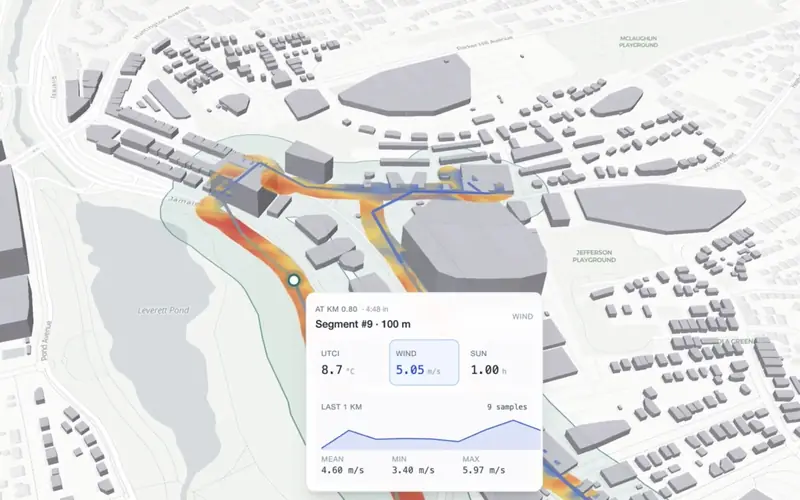
Heat, sun and headwind along a route.
- Replay a marathon route kilometre by kilometre: heat, sun and headwind exposure.
- For event organisers and route planners
-
 Our demo
Portfolio performance
by infrared.city
Our demoPortfolio performance
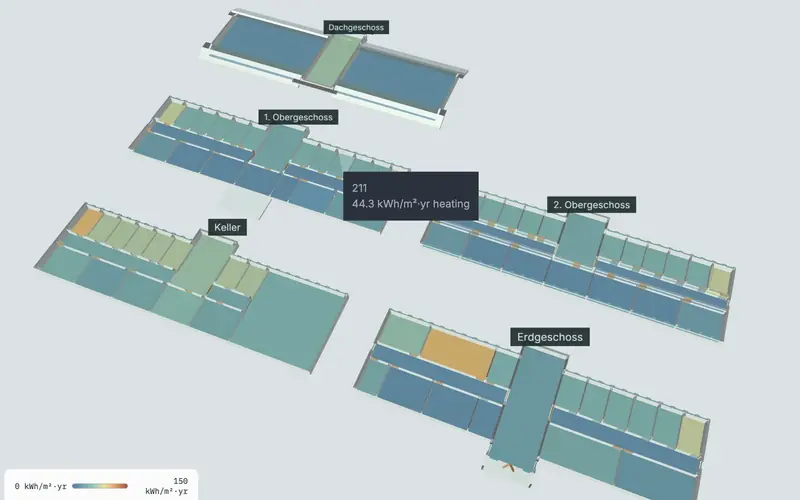
Daylight, solar and comfort across a portfolio.
- Daylight, facade sun, energy and outdoor comfort across a prepared property portfolio.
- For property owners and investors
-
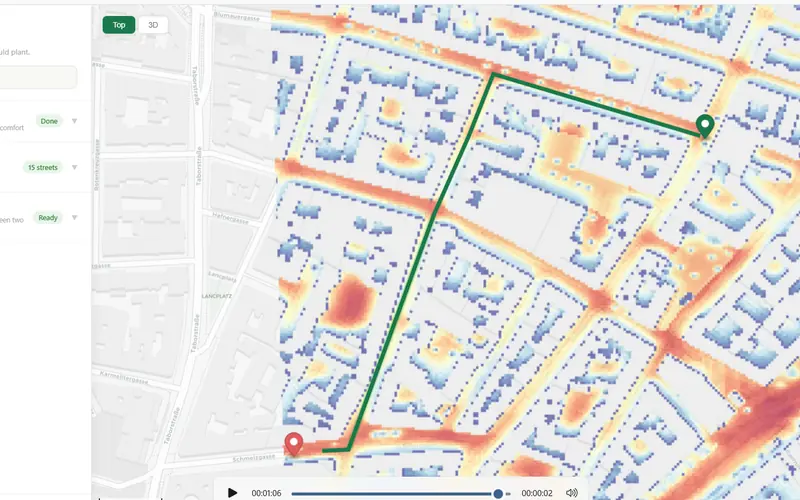 Buildathon 2026
Treeat
by Mari
Buildathon 2026Treeat
Places street trees for the most cooling, then routes people along the coolest streets.
- Perceived heat (UTCI) across Leopoldstadt, Vienna
- Ranks streets by cooling per tree
- Python and OpenStreetMap
-
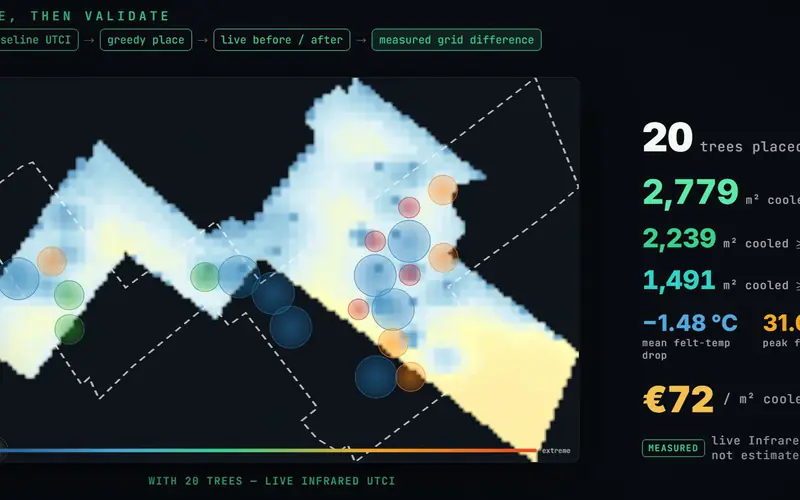 Buildathon 2026
CoolSpend
by Rafik El Khoury
Buildathon 2026CoolSpend
Tells Barcelona where to plant street trees and spends a fixed budget where heat hurts most.
- Measures the cooling on live UTCI
- Python, FastAPI, React and deck.gl
-
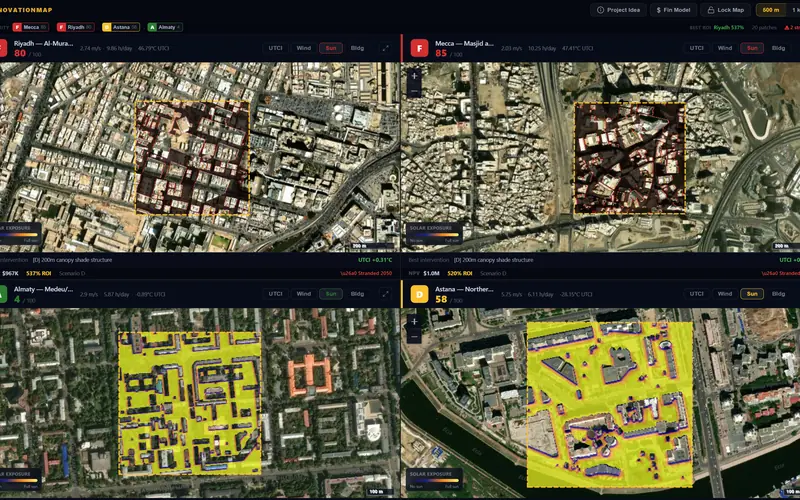 Buildathon 2026
Renovation Map Toolkit
by Medinaura
Buildathon 2026Renovation Map Toolkit
Turns heat stress in public spaces into an indicative renovation budget.
- UTCI, wind, sun and solar on real sites
- Python, React and Leaflet
-
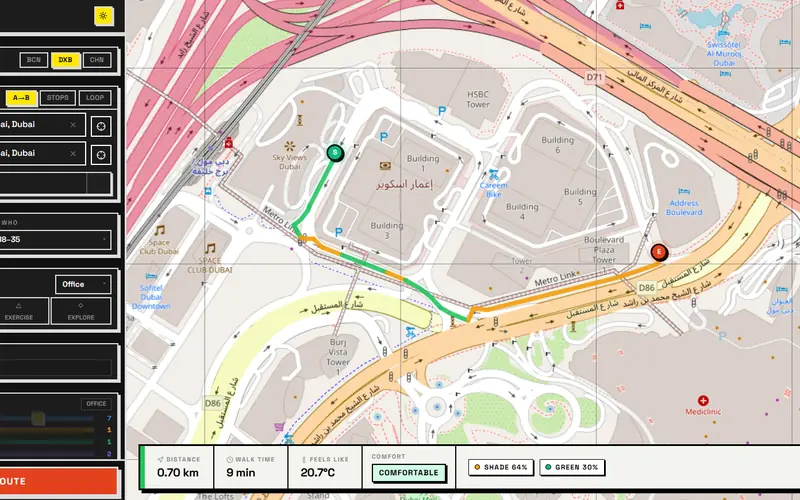 Buildathon 2026
Detour
by xBuild
Buildathon 2026Detour
A walking navigator that picks the route by comfort, not only by distance.
- Routes on UTCI, shade, wind comfort and trees
- OpenStreetMap street graph
-
 Buildathon 2026
HeatGuard
by HeatGuard
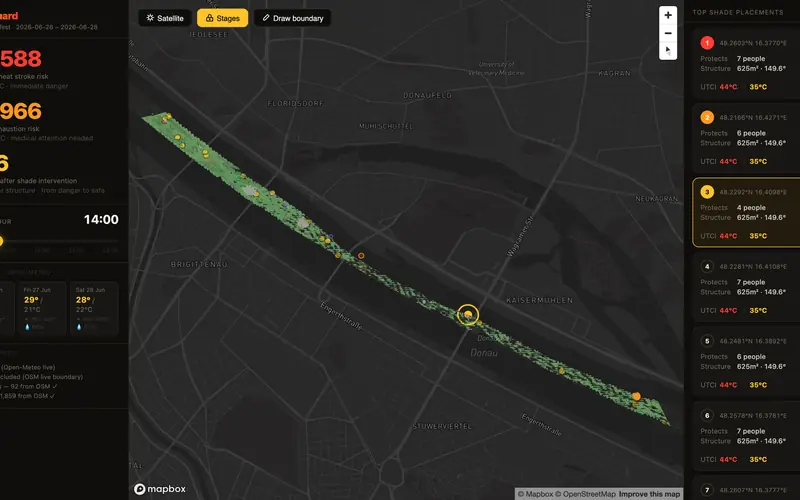
Buildathon 2026HeatGuard
Festival heat risk, hour by hour, and the least shade that protects the crowd.
- UTCI on a 3D city with live weather
- Places each shade structure on the map
-
 Buildathon 2026
WindSite
by Team Turbine
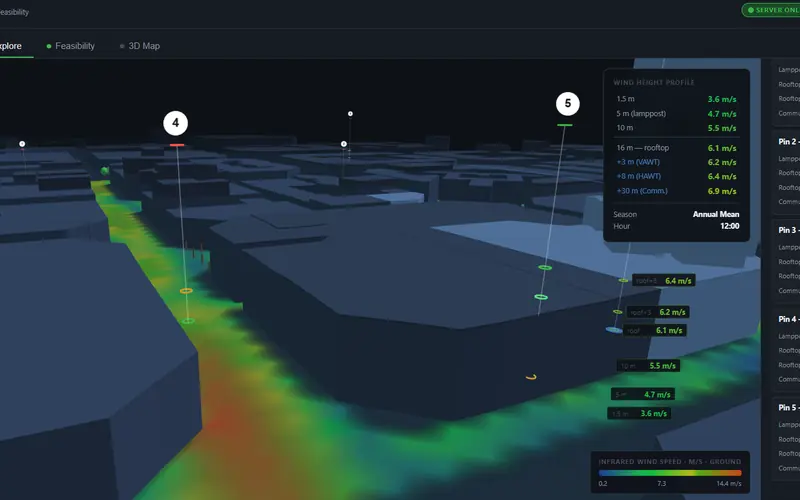
Buildathon 2026WindSite
Finds the rooftops where a small wind turbine is worth it.
- SDK wind plus the local weather file
- Seasonal wind per location
-
 Buildathon 2026
Cairo PEDCOMF
by Antony Hozeen
Buildathon 2026Cairo PEDCOMF
Lets home buyers check the outdoor comfort of a residential compound before they buy.
- Wind comfort, sky view, UTCI and solar
- Cairo compounds side by side
-
 Buildathon 2026
simSPACE and Tree SimCity
by CCAE / Cork Centre for Architectural Education
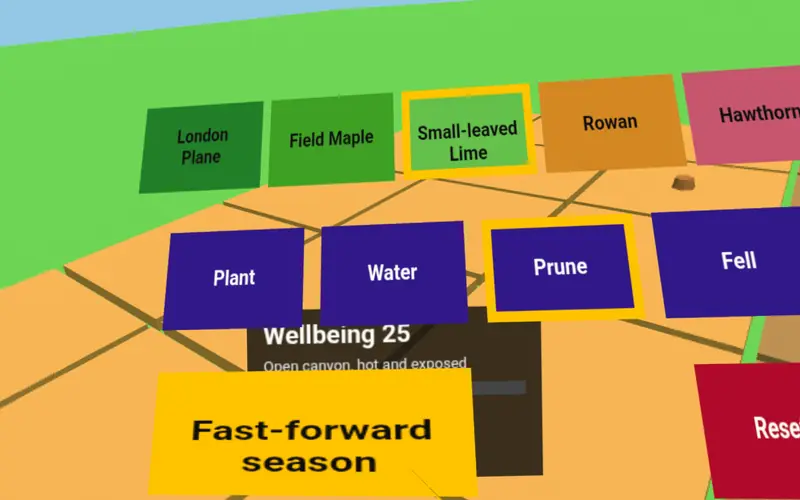
Buildathon 2026simSPACE and Tree SimCity
Grow an urban forest over 150 years of climate, played on real wind, sun and UTCI grids.
- Two games, one in WebXR
- Species diversity keeps the forest stable
-
 Buildathon 2026
CoolTure
by CoolTure
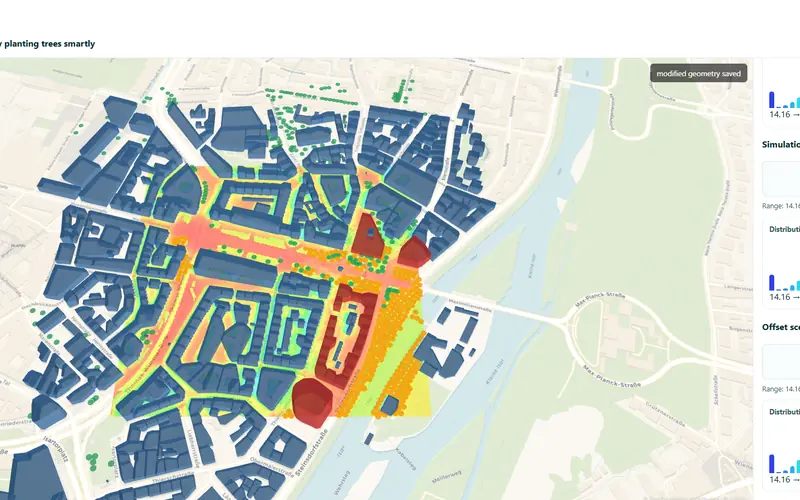
Buildathon 2026CoolTure
Adds trees until the rise in perceived heat is offset.
- Fast UTCI and wind runs in a loop
- FastAPI and React
-
 Buildathon 2026
CIRCE
by Team NS
Buildathon 2026CIRCE
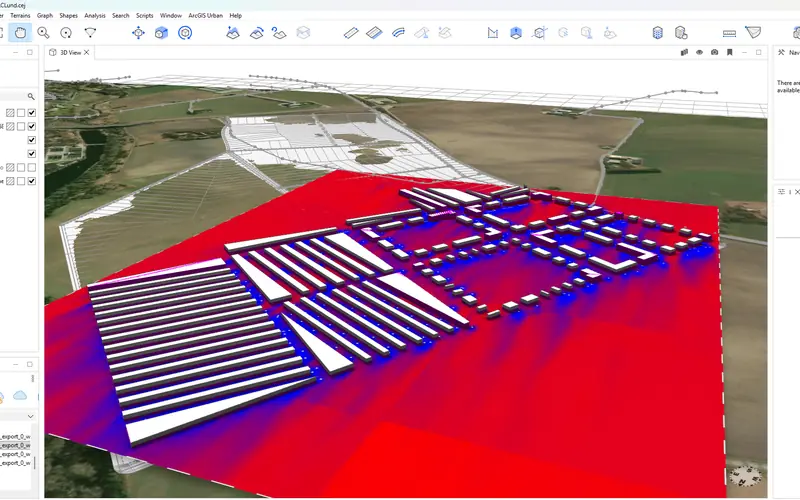
Sends an ArcGIS CityEngine scene to infrared.city and brings the wind result back.
- Result as a georeferenced GeoTIFF in CityEngine
- Python
-
 Buildathon 2026
CoolRun AI
by Yusuf
Buildathon 2026CoolRun AI
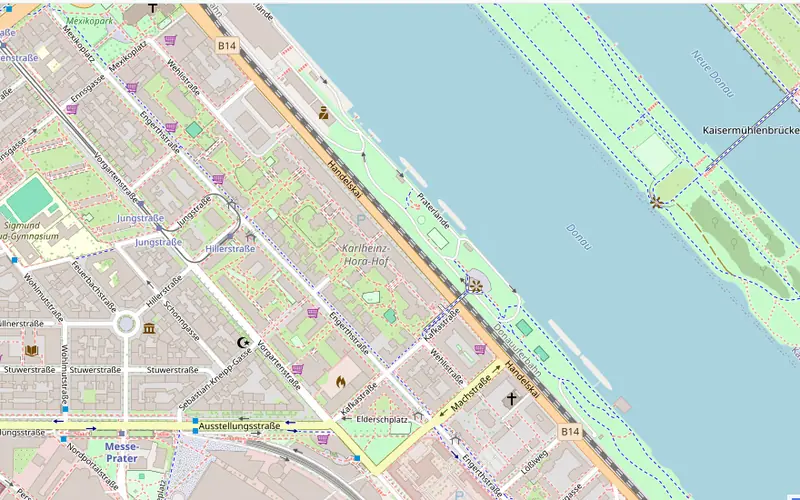
Cooler, tree-rich running routes in Vienna.
- AI tree detection on aerial images plus UTCI
- Leaflet and OpenRouteService
-
 Buildathon 2026
UrbanShade
by Rashi Desadla
Buildathon 2026UrbanShade
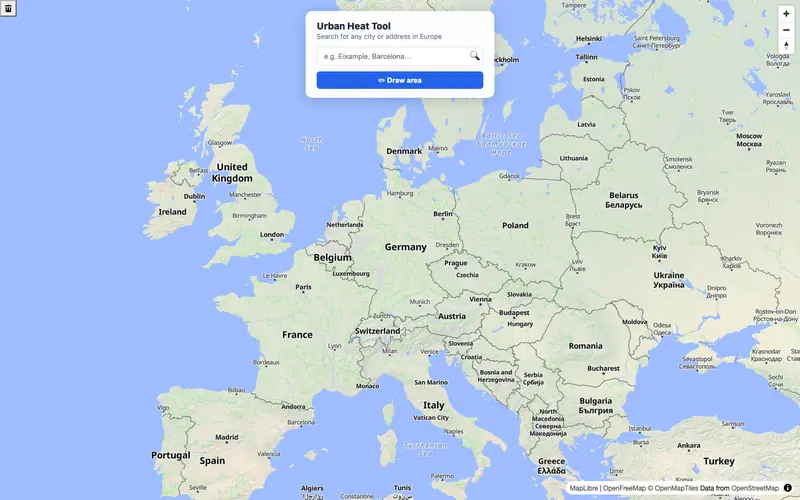
Draw an area anywhere in Europe, run UTCI and cool the hottest streets.
- Finds the hottest quarter of the area
- Suggests where trees help most