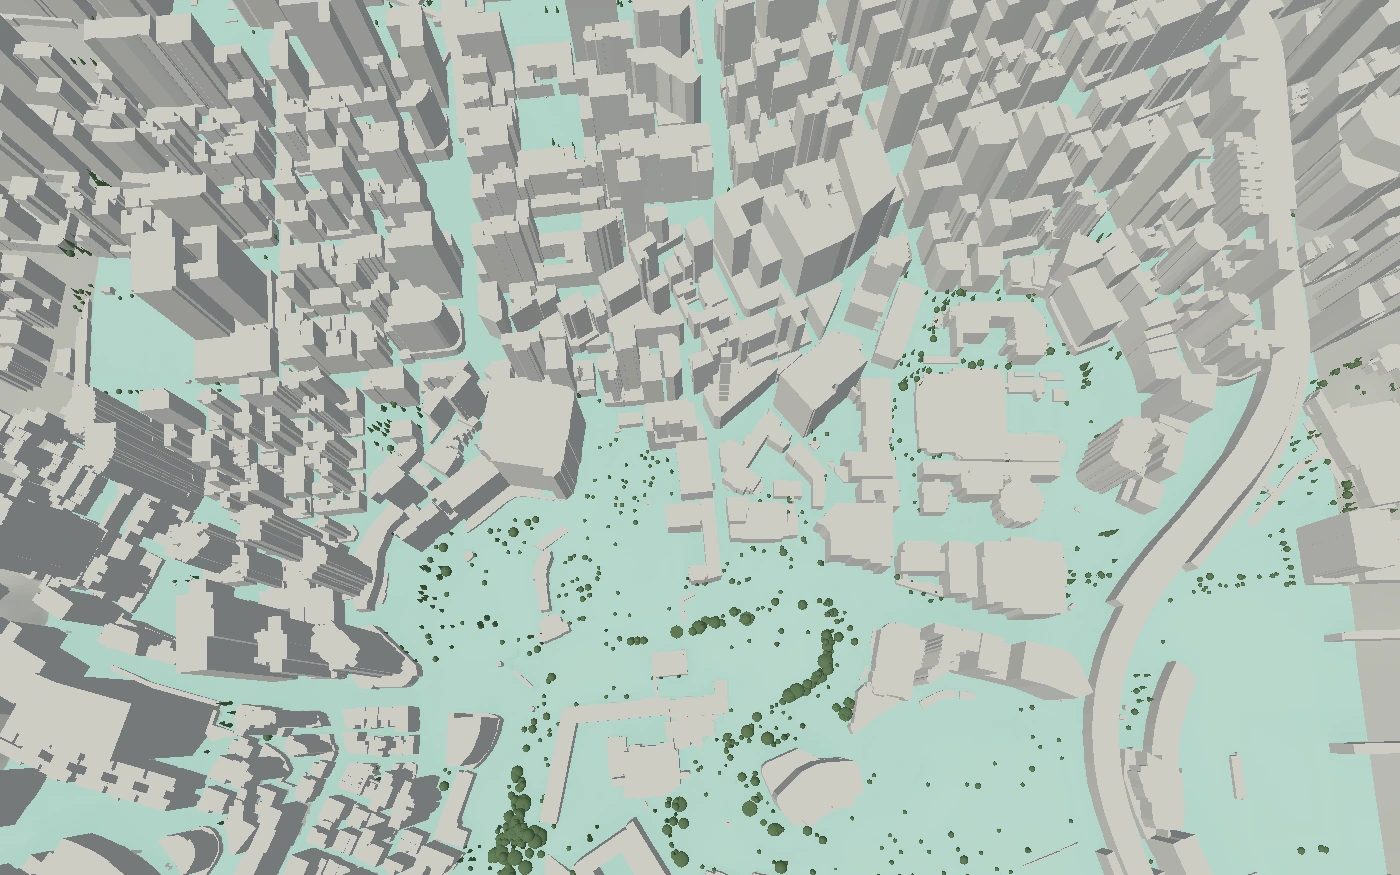
How does this compare with ENVI-met, SOLWEIG or PALM-4U? See when to use which tool .
12 models Wind, perceived heat, sun, daylight and interior.
0.1 to 1 m grid A value every 0.1 to 1 m, from rooms to cities.
One interface Platform, plugins and API run the same models.
All simulation models
Model What it shows Output Aligned with Wind Wind Speed Airflow around buildings m/s VDI 3787-4 Pedestrian Wind Comfort Suitability for outdoor activities Comfort class Lawson (LDDC), NEN 8100, VDI 3787-4 Heat and comfort Thermal Comfort Time in comfortable conditions % of time UTCI, Bröde et al. 2012, VDI 3787-2, VDI 3785-1 Heat Stress Occurrence of outdoor heat stress % of time UTCI, Bröde et al. 2012, VDI 3787-2 Cold Stress Occurrence of outdoor cold stress % of time UTCI, Bröde et al. 2012, VDI 3787-2 Microclimate (UTCI) Perceived heat (UTCI) UTCI · °C UTCI, Bröde et al. 2012, VDI 3787-2, VDI 3787-8 Sun and light Daylight Availability Direct-sun availability 0–100% score Perez all-weather sky, EN 17037 Sky View Factors Open sky and enclosure % visible sky VDI 3787-1 Direct Sun Hours Duration of direct sunlight Hours EN 17037 sunlight exposure Solar Radiation Solar energy reaching surfaces kWh/m² ISO 52010-1, VDI 3789-2, Perez all-weather sky Interior Interior Daylight Factor Diffuse daylight inside rooms Daylight factor · % CIE standard sky (ISO 15469), EN 17037 Energy Balance Heating and cooling energy need kWh/m²·yr ISO 13790 hourly (Annex C) and monthly methods, EN 15265 test cases, ASHRAE 140 (BESTEST), ISO 6946, ISO 13370
How each model was checked: read the validation notes
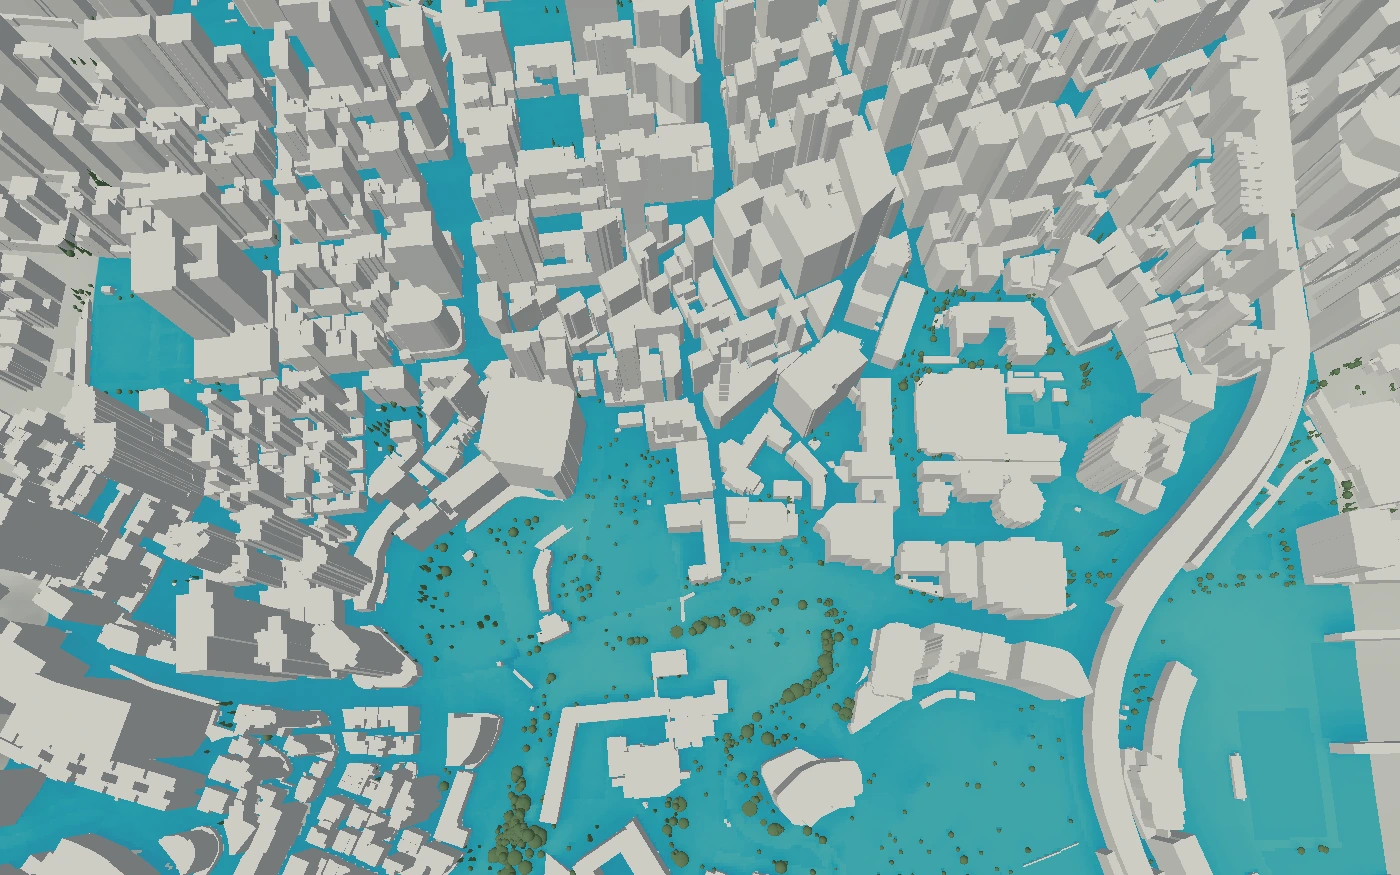
Wind Speed Where will buildings accelerate wind, and where will they create shelter?
≈ 0.6 m/s Between buildings ≈ 5.2 m/s Open park area 0 m/s 10 m/s
Hong Kong · wind speed · fixed 0–10 m/s scale
Inputs Building geometry, reference wind speed and wind direction.
Output Wind speed in m/s across an outdoor ground grid.
Results on (no) (no) (no)
Method AI model trained on CFD
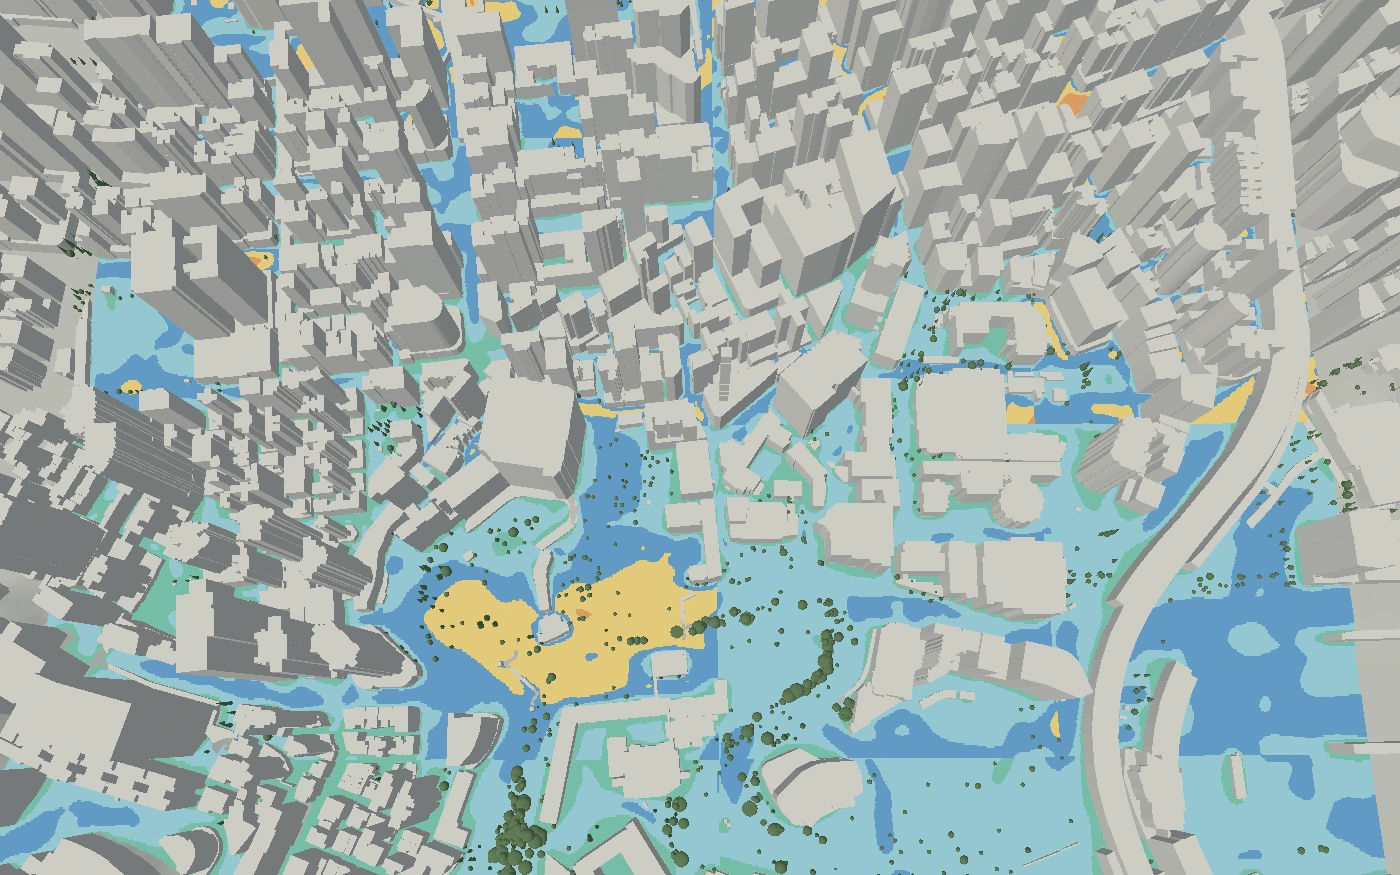
Pedestrian Wind Comfort Which places support sitting, standing or walking through the year?
Class A Between buildings Class D Open park area
Comfort classes A–E; S15/S20 mark safety thresholds. Hong Kong · annual wind comfort · Lawson 2001
Inputs Building geometry, a weather file with hourly wind speed and direction, and a comfort criterion.
Output Outdoor comfort categories on a ground grid.
Results on (no) (no) (no)
Method Lawson, NEN 8100, Davenport, VDI 3787
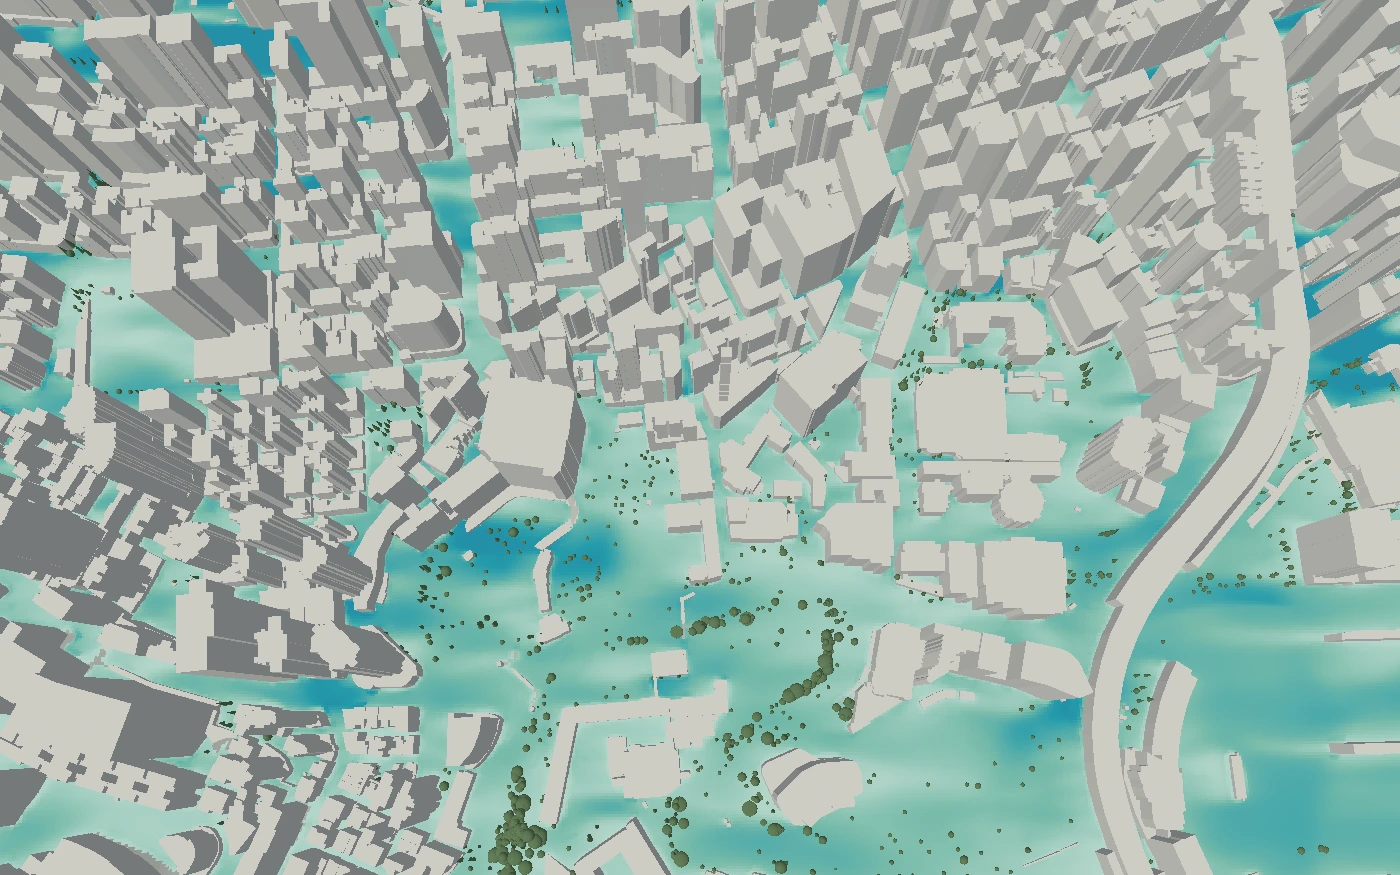
Thermal Comfort Which places remain comfortable during the selected period?
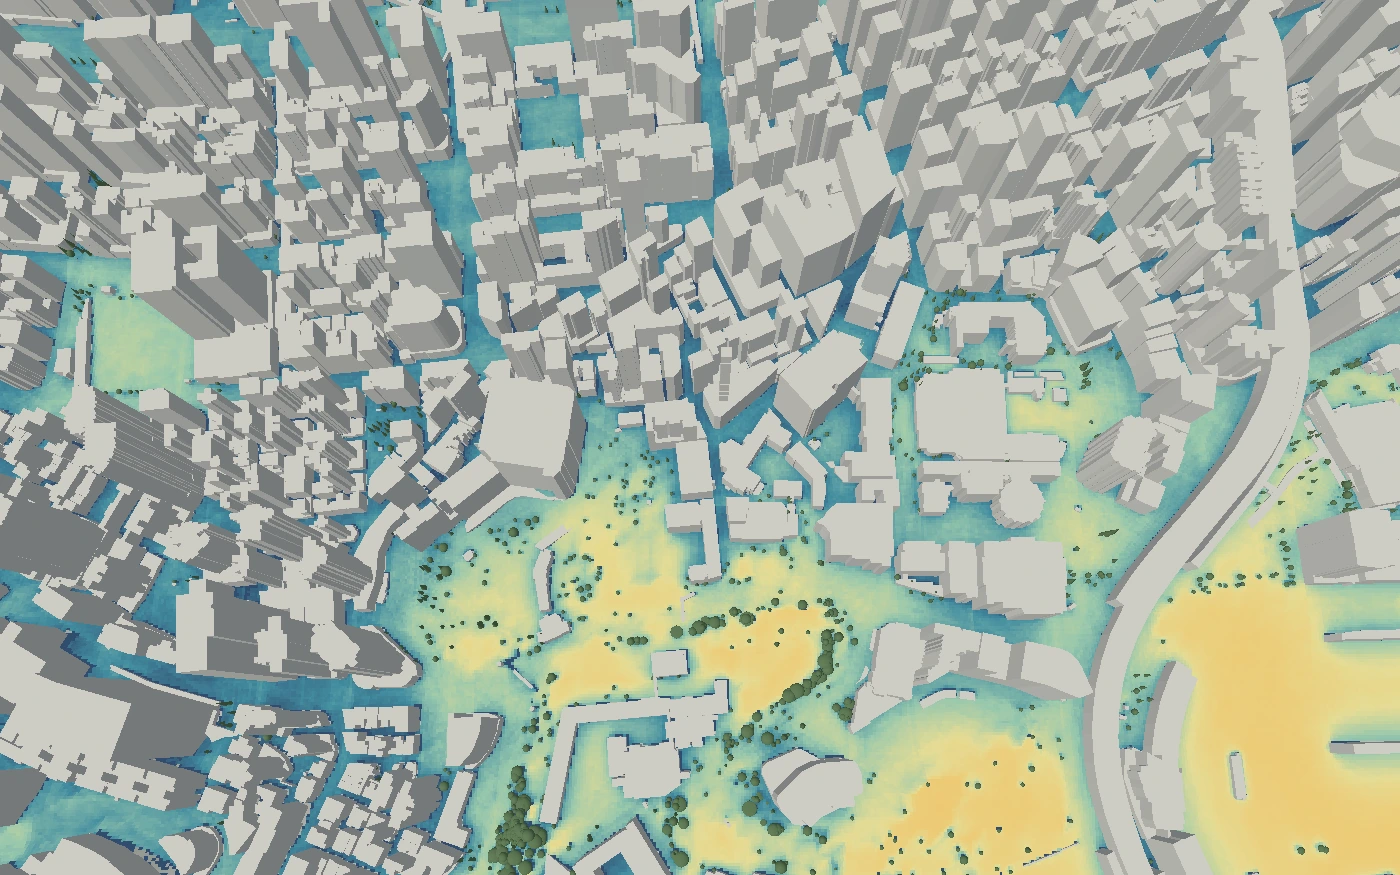
≈ 39% Open park area ≈ 57% Between buildings 0% 100%
Hong Kong · share of daytime hours with UTCI 9–26 °C · annual, 09:00–17:00
Inputs Weather, time period, buildings, trees, shade sails and canopies, and facade, roof and ground materials.
Output Percentage of selected time in thermal comfort at each ground cell.
Results on (no) (no) (no)
Method UTCI, comfort band 9 to 26 °C
Heat Stress Where is heat stress recurrent in the selected period?
≈ 38% Between buildings ≈ 58% Open park area 0% 100%
Hong Kong · share of daytime hours above UTCI 26 °C · annual, 09:00–17:00
Inputs Weather, time period, buildings, trees, shade sails and canopies, and facade, roof and ground materials.
Output Percentage of selected time in heat stress at each ground cell.
Results on (no) (no) (no)
Method UTCI above 26 °C
Cold Stress Where is winter discomfort recurrent in the selected period?
≈ 2% Open park area ≈ 5% Between buildings 0% 100%
Hong Kong · share of daytime hours below UTCI 9 °C · annual, 09:00–17:00
Inputs Weather, time period, buildings, trees, shade sails and canopies, and facade, roof and ground materials.
Output Percentage of selected time in cold stress at each ground cell.
Results on (no) (no) (no)
Method UTCI below 9 °C
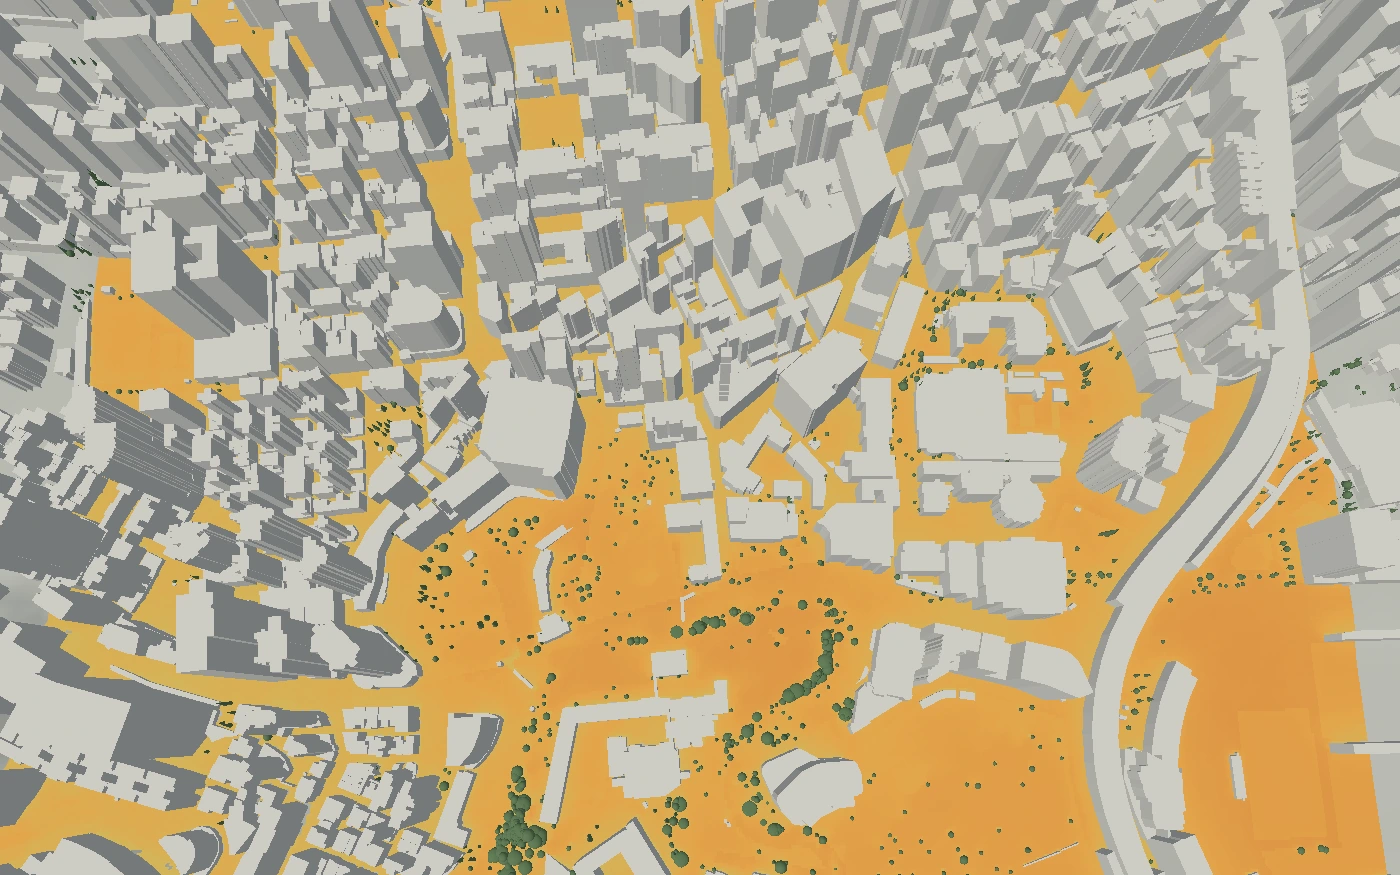
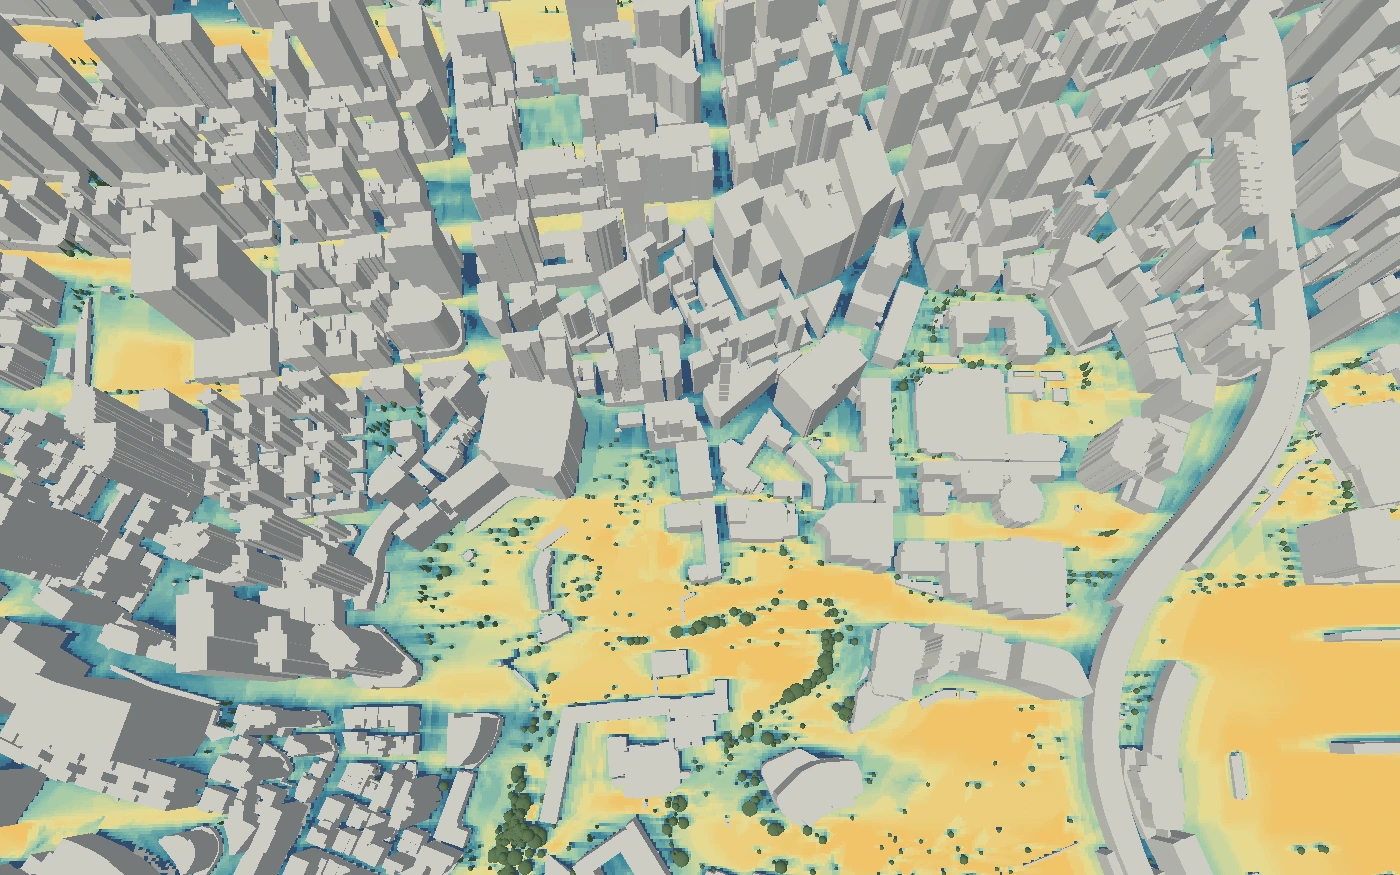
Microclimate (UTCI) How hot or cold does each outdoor place feel?
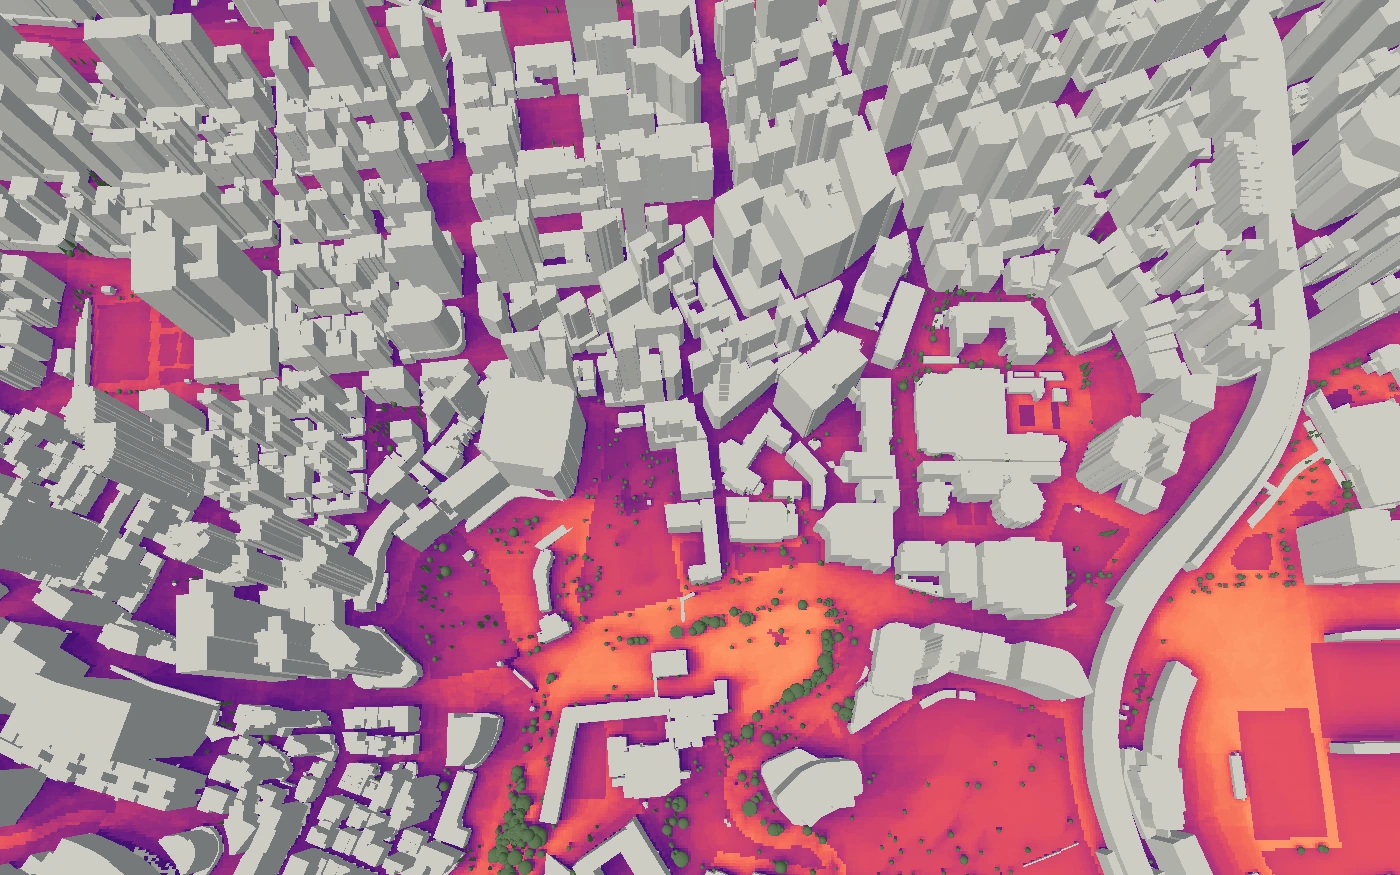
≈ 31.1 °C Between buildings ≈ 35.6 °C Open park area 28 °C 38 °C
Hong Kong · perceived heat (UTCI)
Inputs Weather, time period, buildings, trees, shade sails and canopies, and facade, roof and ground materials.
Output UTCI in °C across an outdoor ground grid.
Results on (no) (no) (no)
Method UTCI (perceived temperature)
Daylight Availability How reliably does direct sun reach this place during the selected window?
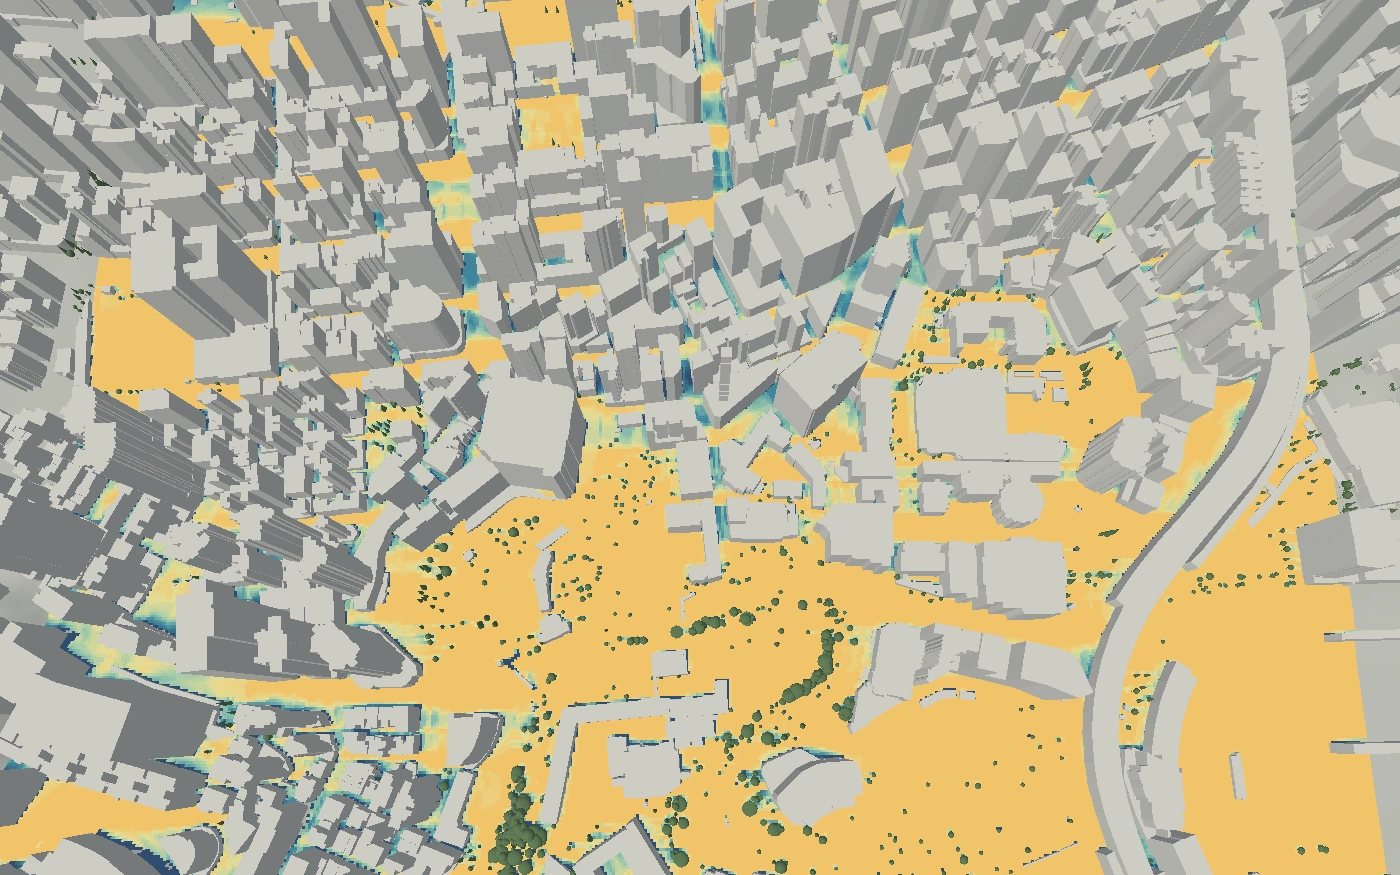
≈ 60% Between buildings ≈ 100% Between buildings 0% 100%
Hong Kong · direct-sun availability score · August, 09:00–17:00
Inputs Location, date and hour range, plus buildings, vegetation and terrain.
Output Direct-sun availability from 0–100%.
Results on (no)
Method Ray-traced sun positions
Sky View Factors Where is the site open to the sky and where is it enclosed?
≈ 18% Between buildings ≈ 83% Open park area 0% 100%
Hong Kong · visible sky
Inputs Building geometry with optional vegetation, terrain or chosen surface sensors.
Output Visible sky from 0–100%.
Results on (no)
Method Hemispherical ray trace
Direct Sun Hours How long is each place in direct sun?
≈ 88 h Between buildings ≈ 270 h Between buildings 0 h 279 h
Hong Kong · cumulative direct sun
Inputs Location, date and hour range, plus buildings, vegetation and terrain.
Output Hours of direct sun.
Results on (no)
Method Ray-traced sun positions
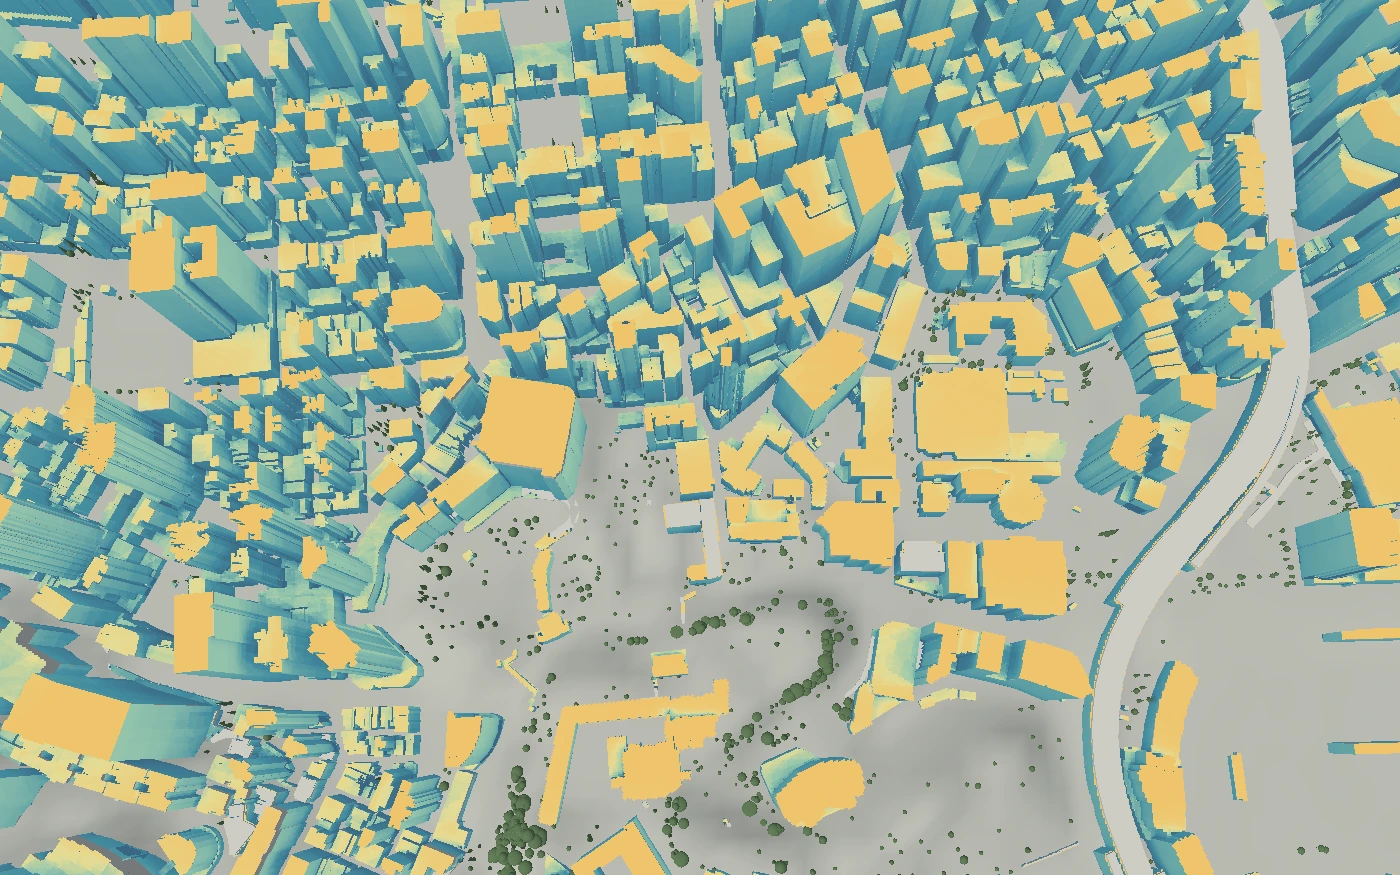
Solar Radiation Where does solar energy reach the site and building envelope?
0 kWh/m² 136 kWh/m²
Hong Kong · façade and roof solar exposure
Inputs Weather radiation data, location, time range, buildings, trees and shade structures.
Output Shortwave solar energy in kWh/m².
Results on (no)
Method Sun and sky model from weather data
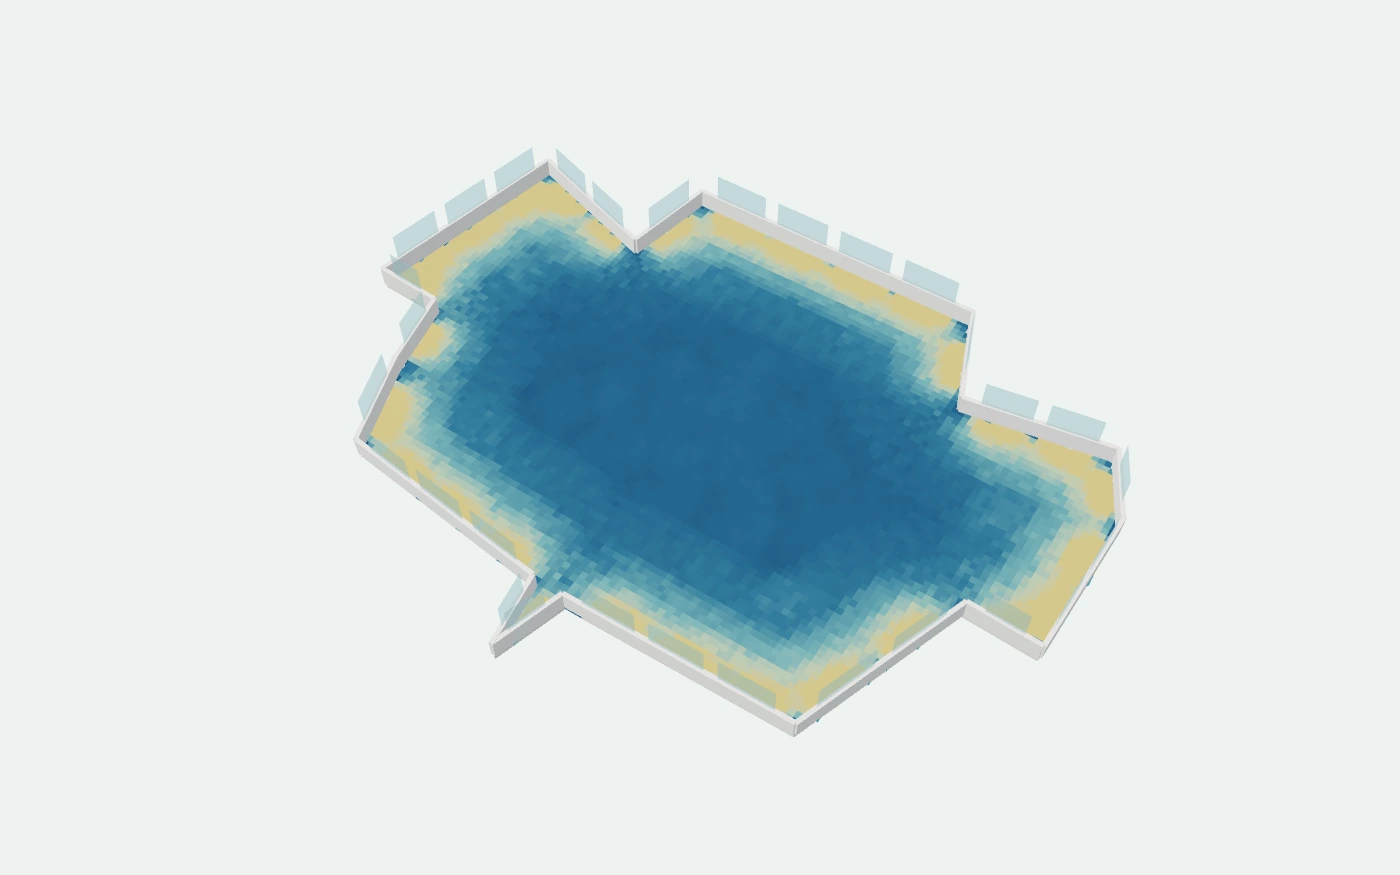
Interior Daylight Factor How much diffuse daylight reaches this room under a standard overcast sky?
0% 10%+
Hong Kong tower · floor 37 · daylight factor · CIE overcast sky
Inputs Room barriers, openings, work-plane sensors and optional external context.
Output Daylight factor as a percentage at interior sensor points.
Results on (no) (no) (no)
Method CIE standard overcast sky
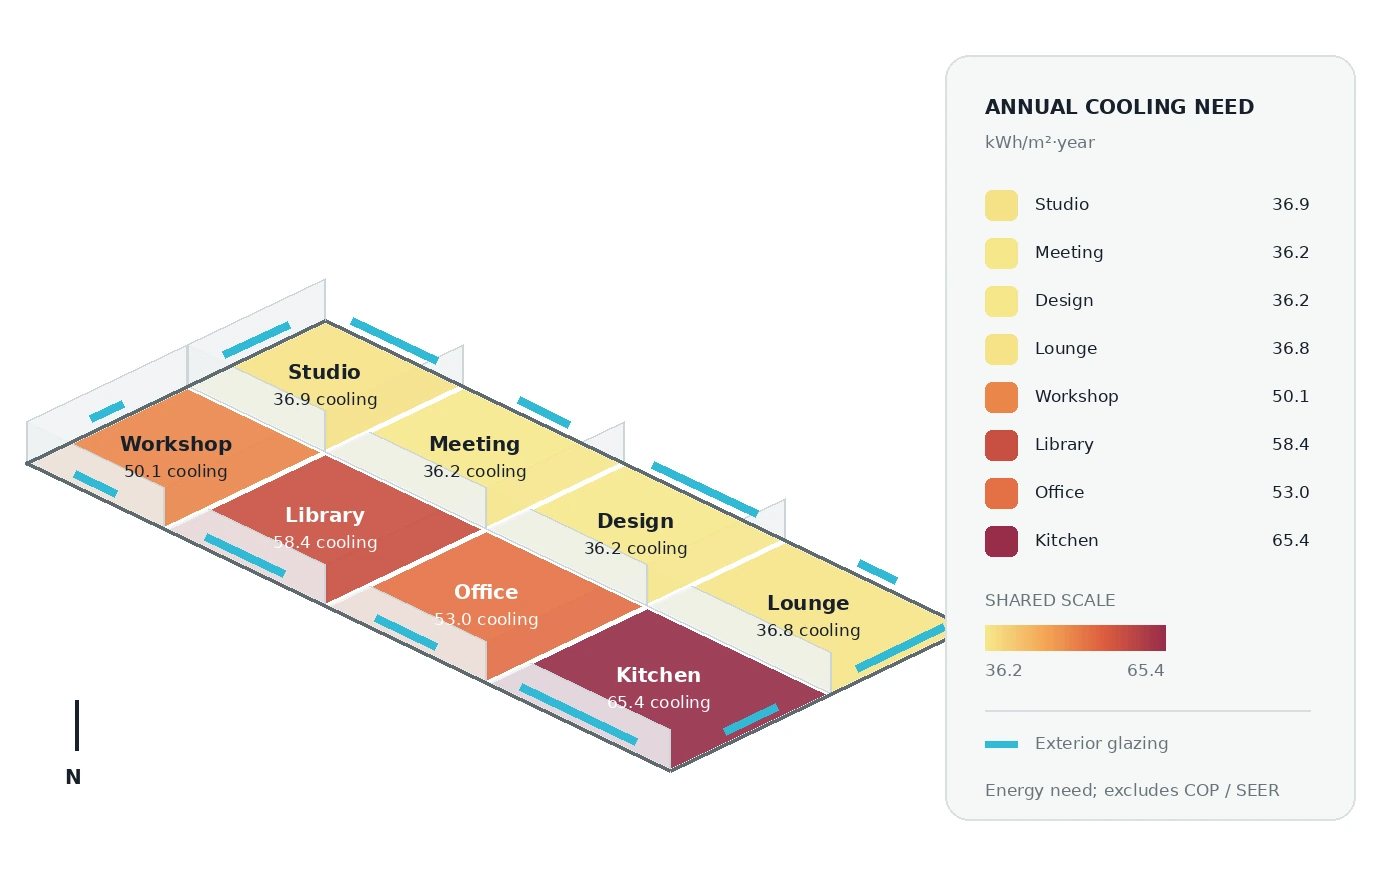
Energy Balance How do envelope, solar gains and weather change heating and cooling demand?
Eight rooms · annual cooling energy need per m² · Hong Kong weather, 2021
Inputs Spaces, barriers, openings, weather and energy settings.
Output Heating and cooling need per room, per hour and per month, and annual kWh/m²·yr.
Results on (no) (no) (no)
Method ISO 13790 hourly method
Hong Kong weather, 2021. Eight rectangular rooms with shared walls, medium construction settings and continuous operation. No surrounding buildings. This is an early design example. Energy need does not include equipment efficiency.
Annual energy need, kWh/m² Room Heating Cooling Studio 2.1 36.9 Lounge 1.9 36.8 Workshop 1.8 50.1 Meeting 1.5 36.2 Design 1.5 36.2 Kitchen 1.5 65.4 Library 1.2 58.4 Office 1.2 53.0
Try it on your own site
A first run takes about a minute. Or bring one real project to a call.