Live layer and digital twin

Turn your city into a live, queryable climate layerKnow which streets, schools and care homes get dangerous tomorrow. Heat, shade, wind and sun for tomorrow, a typical summer or 2050.
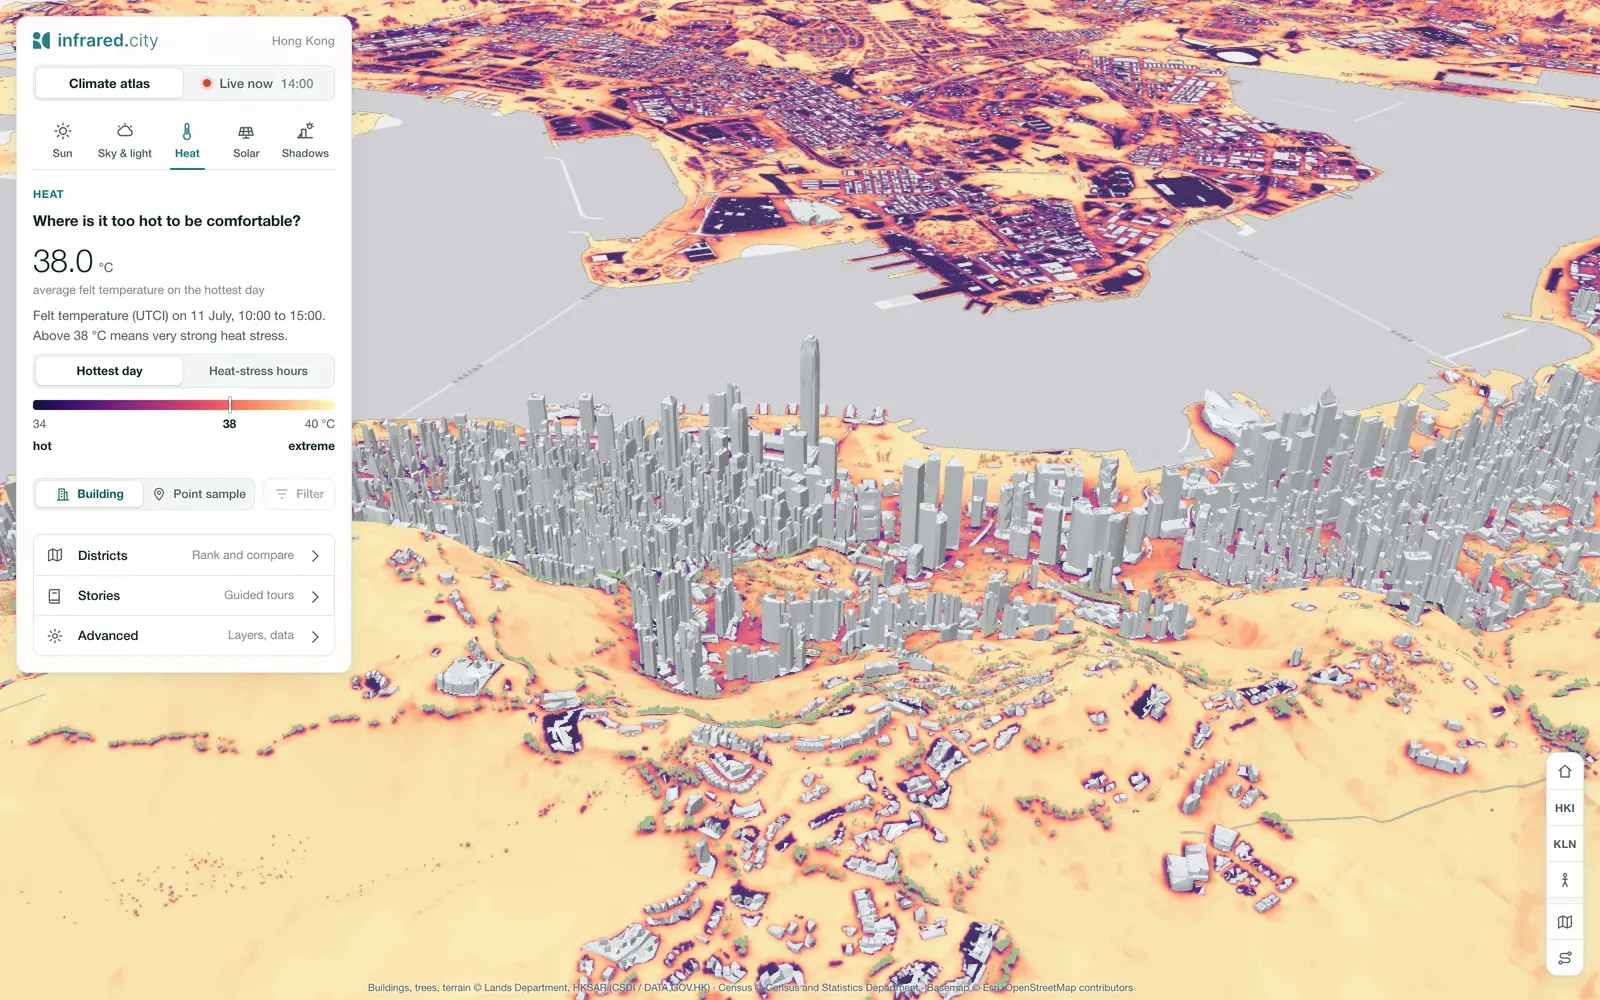
The Hong Kong digital twin in the heat view: perceived temperature (UTCI) across streets, parks and roofs, with the city's towers in grey Explore Hong Kong live
Example project: Hong Kong. Buildings, trees and terrain © Lands Department, HKSAR.
500xfasterThe city is prepared once. After that, each hourly update runs about 500x faster than a fresh SDK simulation of the same area. That lets us recompute an entire city, hundreds of square kilometres, every hour.
Queryableevery street
2050climate scenariosBesides the live forecast, the same city runs a typical year from a standard weather file, or 2050 weather made by morphing that file. You can test adaptation measures on all of them.
3D Tilesand map tiles

Fast, reliable results, tested against street measurements in four cities. See how we compare

A microclimate layer for your digital twin

The entire city, at street level, every hour: a digital climate twin.

A sensor reads one corner, we simulate every street

Sensors show it is hot, now, at a few points. Simulation shows where, on every street, tomorrow, in 2050 and after you plant the trees.

  • MeasurePredict
  • A few pointsEvery street
  • NowThe next 72 hours, and scenarios
  • Nothing to testTest adaptation and scenarios
What goes in: your city model and three kinds of weather: the live forecast (every hour, 72 hours ahead), a typical summer or year, and 2050 climate scenarios. Infrared Core keeps the live layer of the entire city at street level, every hour, 72 hours ahead, with optional add-ons such as ice risk and a heat risk index. What comes out: 3D Tiles for digital twins, map tiles for planning dashboards and GIS, and a queryable dataset for routing and behaviour apps.

Into the twin you run. It streams into the twin you already run as 3D Tiles, or into your GIS and dashboards as map tiles. No second model. Export everything, any time: 3D Tiles, map tiles, GeoTIFF and tables. Your results stay yours.

How you get it. A custom deployment for your city, in our EU cloud or on your servers, set up with you. A one-time preparation, then a yearly service. Book a call

Enterprise readyHosted in the EUYour data stays yoursOn-prem possibleSLA available

The queryable dataset

Ask your city a question

Behind the map sits a dataset of every place and every hour. We set up your questions with you.

Ask the live layer

Where will it be hot over the next three days?

2 streets

Which building takes the most sun this week?

Which building takes the most sun this week?

Which of my assets face the most heat?

The live layer as a data cube: a whole city on top, and below it see-through plates for each forecast hour (now, tonight, tomorrow at 6:00, tomorrow at 14:00, 72 hours ahead), each a heat or ice map. Questions appear one by one, such as where it will be hot over the next three days, where cycle paths will freeze tomorrow at 6:00 or whether tomorrow's marathon route is a problem, and the matching places light up with short labels.
Climate adaptation

Test your adaptation plan

Test adaptation measures against tomorrow's forecast, a typical summer and 2050, and compare adaptation scenarios before anything is built.

  • Measures. Trees, shade, cool and permeable surfaces, water or closures.
  • Any weather. The forecast, a typical summer or 2050 climate.
  • Street by street. Compare the scenarios side by side, for the entire city.
A district twin: the base, a cooling design and the difference, hour by hour.

What cities do with it

  • Snow and ice

    Send plough crews where ice forms first.

  • Heat forecast

    Warn people and open cooling spots before the heat peaks.

  • Emergency response

    Place ambulances where heat stress will peak.

  • Facades and assets

    Forecast the sun load on critical buildings.

  • Events

    Plan shade, water and staff, hour by hour.

  • Mobility and routing

    Shade-aware and heat-aware routes in transport and walking apps.

  • Recompute past weather

    Replay any period of past weather with the same engine to backtest triggers.

  • 2050 scenarios

    See how exposure shifts under 2050 weather.

  • Price heat and ice

    Compare heat and ice risk across a portfolio.

Book a call
Example

Live for the City of Luleå

For the City of Luleå we built an ice prediction layer: where ice forms, hour by hour, so plough crews go there first.

  • Cold stress. Where people wait and walk in the cold.
  • Heat risk index. For the warm days of the year.
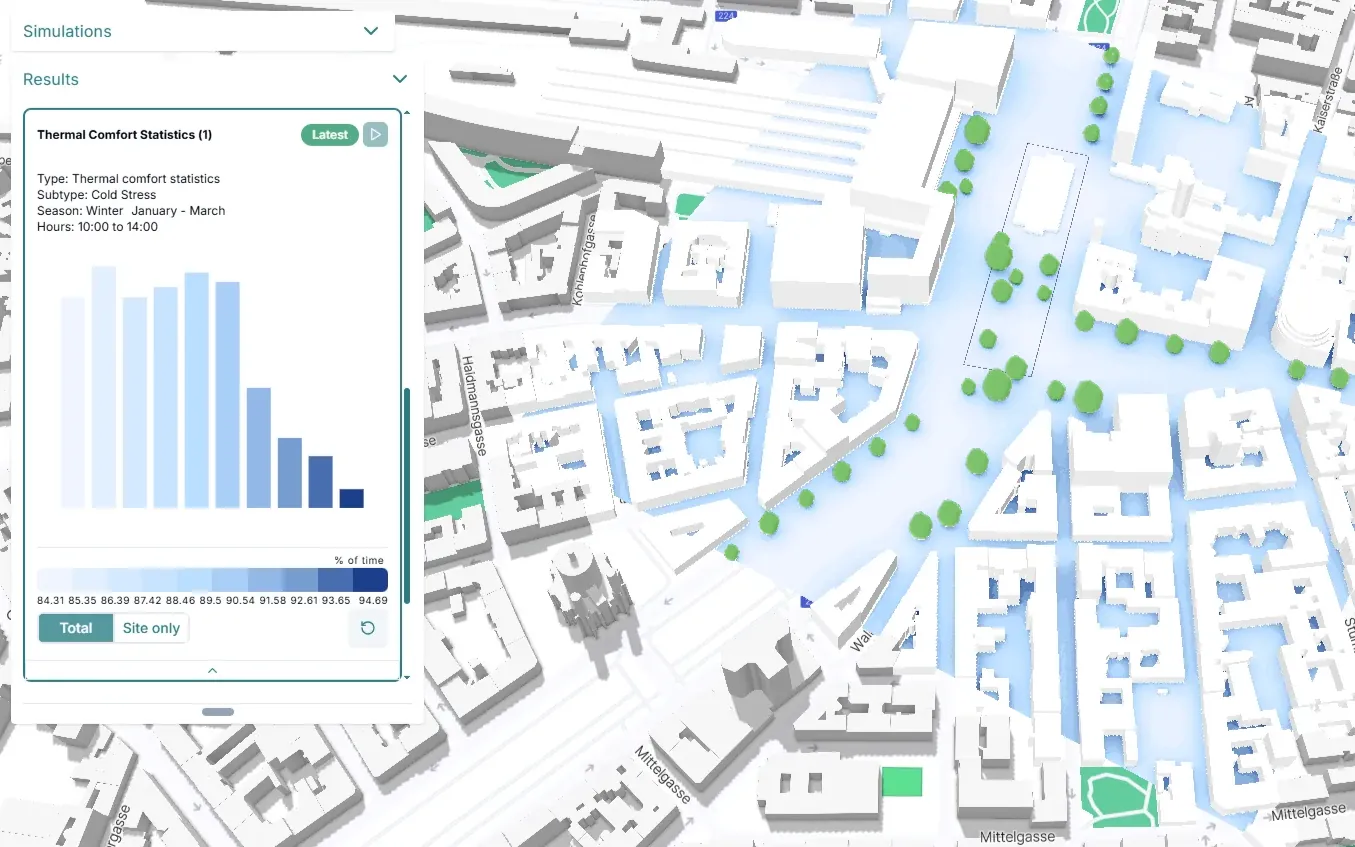
An example view of cold stress in winter: streets and squares coloured by cold hours, with the distribution of the season next to the map
Example view of cold stress in winter, not Luleå data.
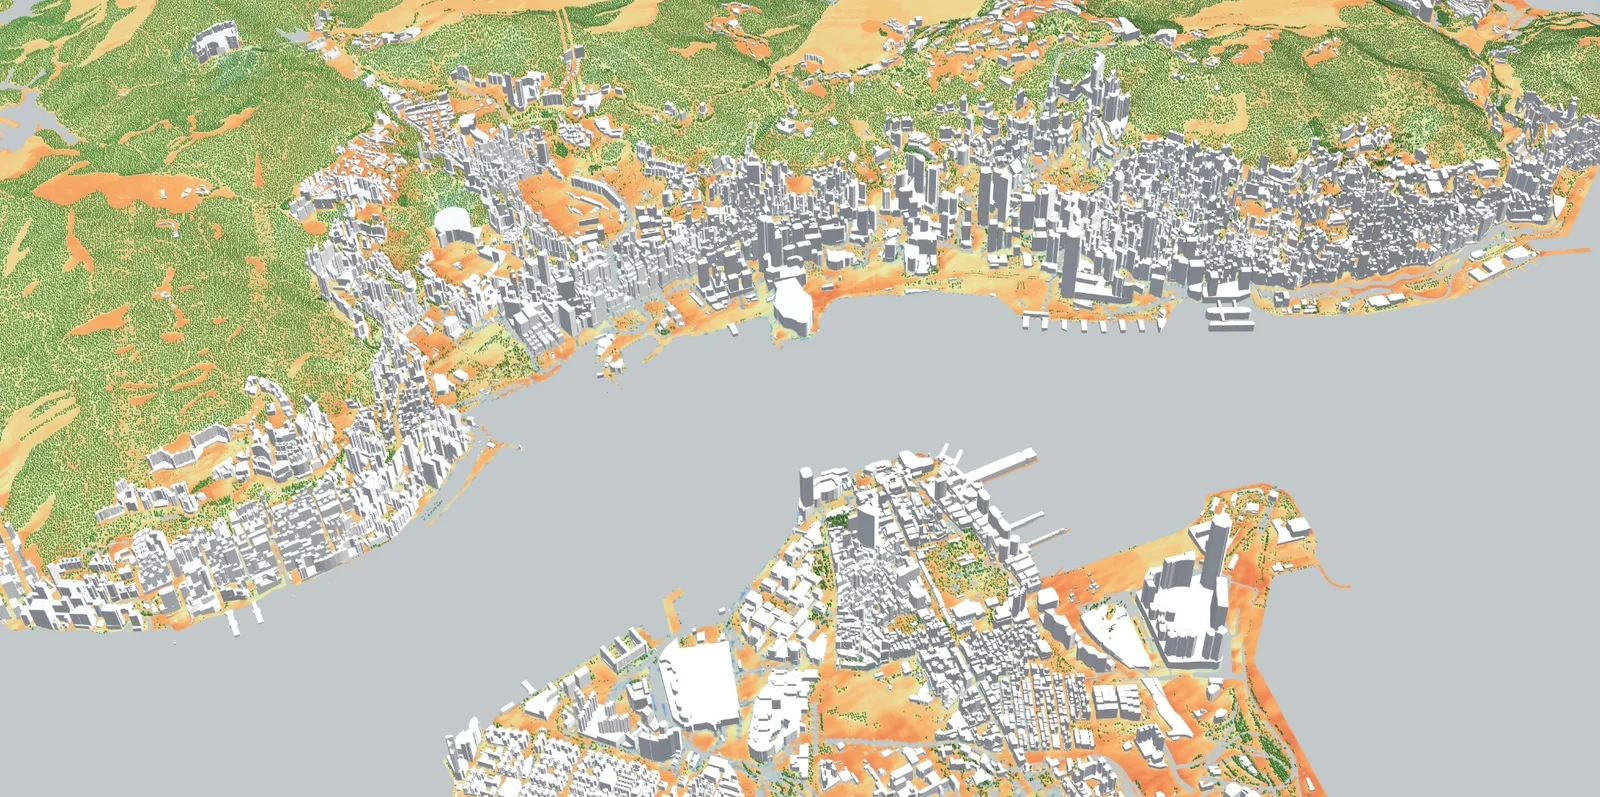
The live layer over Hong Kong: the whole territory from the harbour to the hills, streets and roofs coloured by the result
Example project

A whole city, live: Hong Kong

The whole territory as a live layer, at our highest resolution from a lidar scan: heat and sun, street by street. Use our 3D Tiles in your own viewer, or test it on your data: we run a small area of your city first.

Explore Hong Kong liveBook a call