Demo
Crew monitoring demo
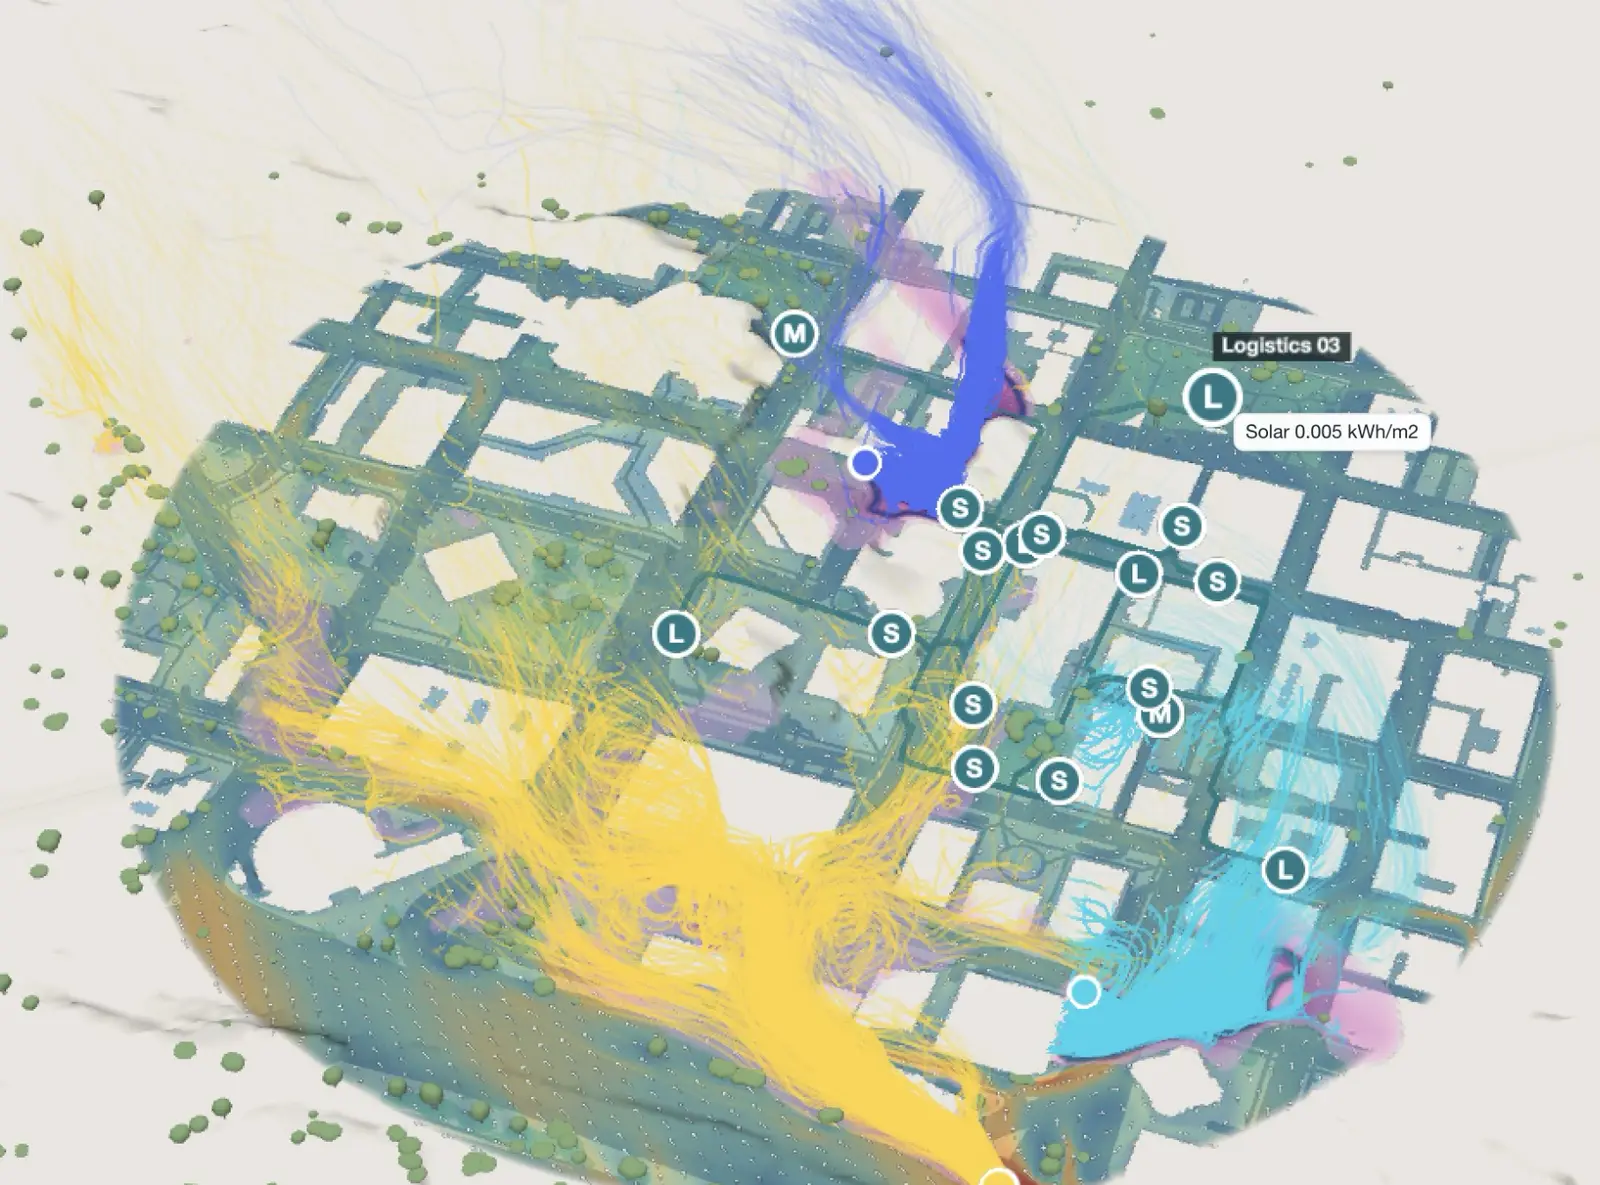
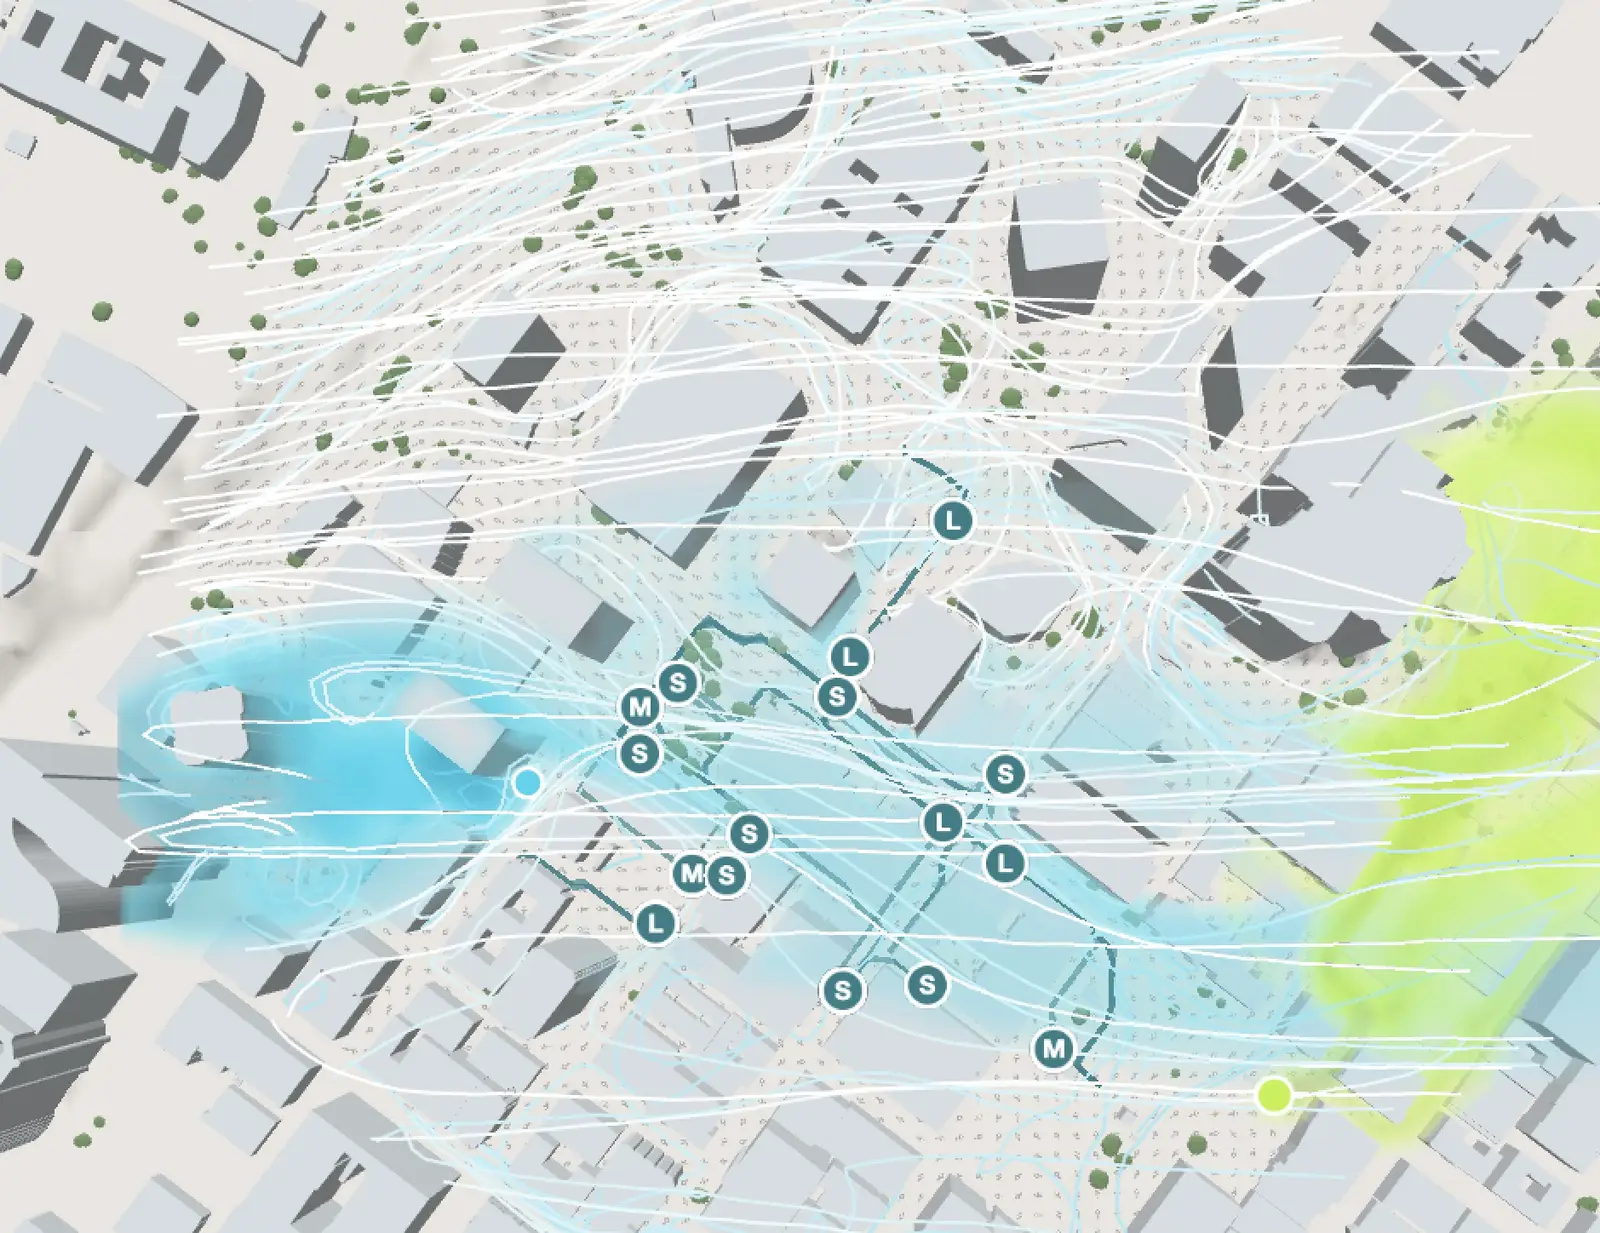
Simulated security, logistics and engine crews in Los Angeles: felt heat at each position and heat load so far in the shift. Shown here with 3D wind and smoke from three sources: soon, on demand.
 Platform Book a call
You already track where your people are. Add felt heat, sun and shade at each position, so far and for the next hours.
Heat builds up over a shift. A dot on a map does not show it. The climate at each position does.
Security staff at an event, engine crews on a slope, logistics teams in a city, patrols on a long outdoor shift: you already know where they are. infrared.city adds what the weather does to them there, at 1 m, hour by hour.
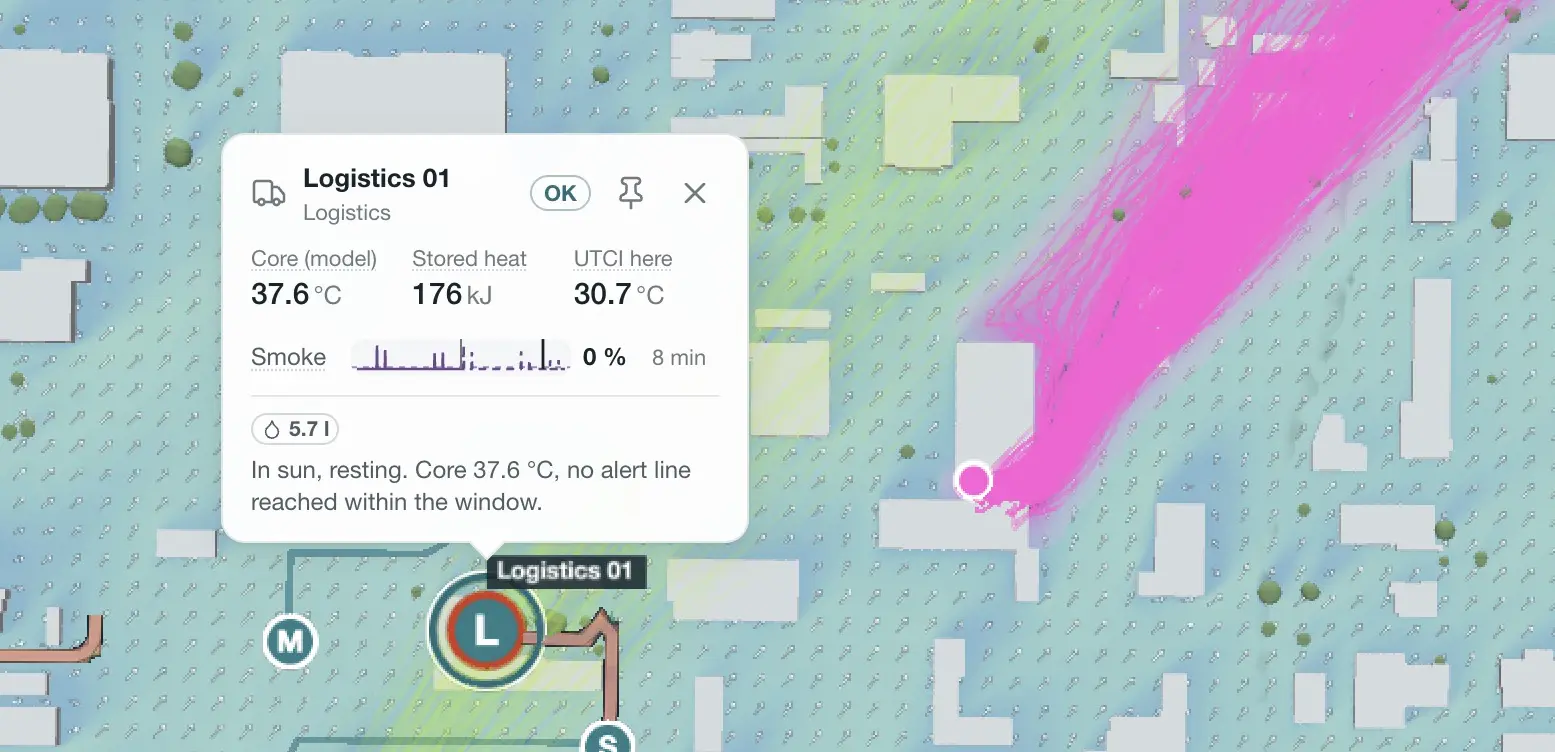
Click a person to see the heat load so far in the shift and the forecast. Your platform sends the positions and the site. We prepare buildings, terrain and trees, run the simulations with the forecast and send the values back. Your app shows them and your team sets the alerts.
Over the day
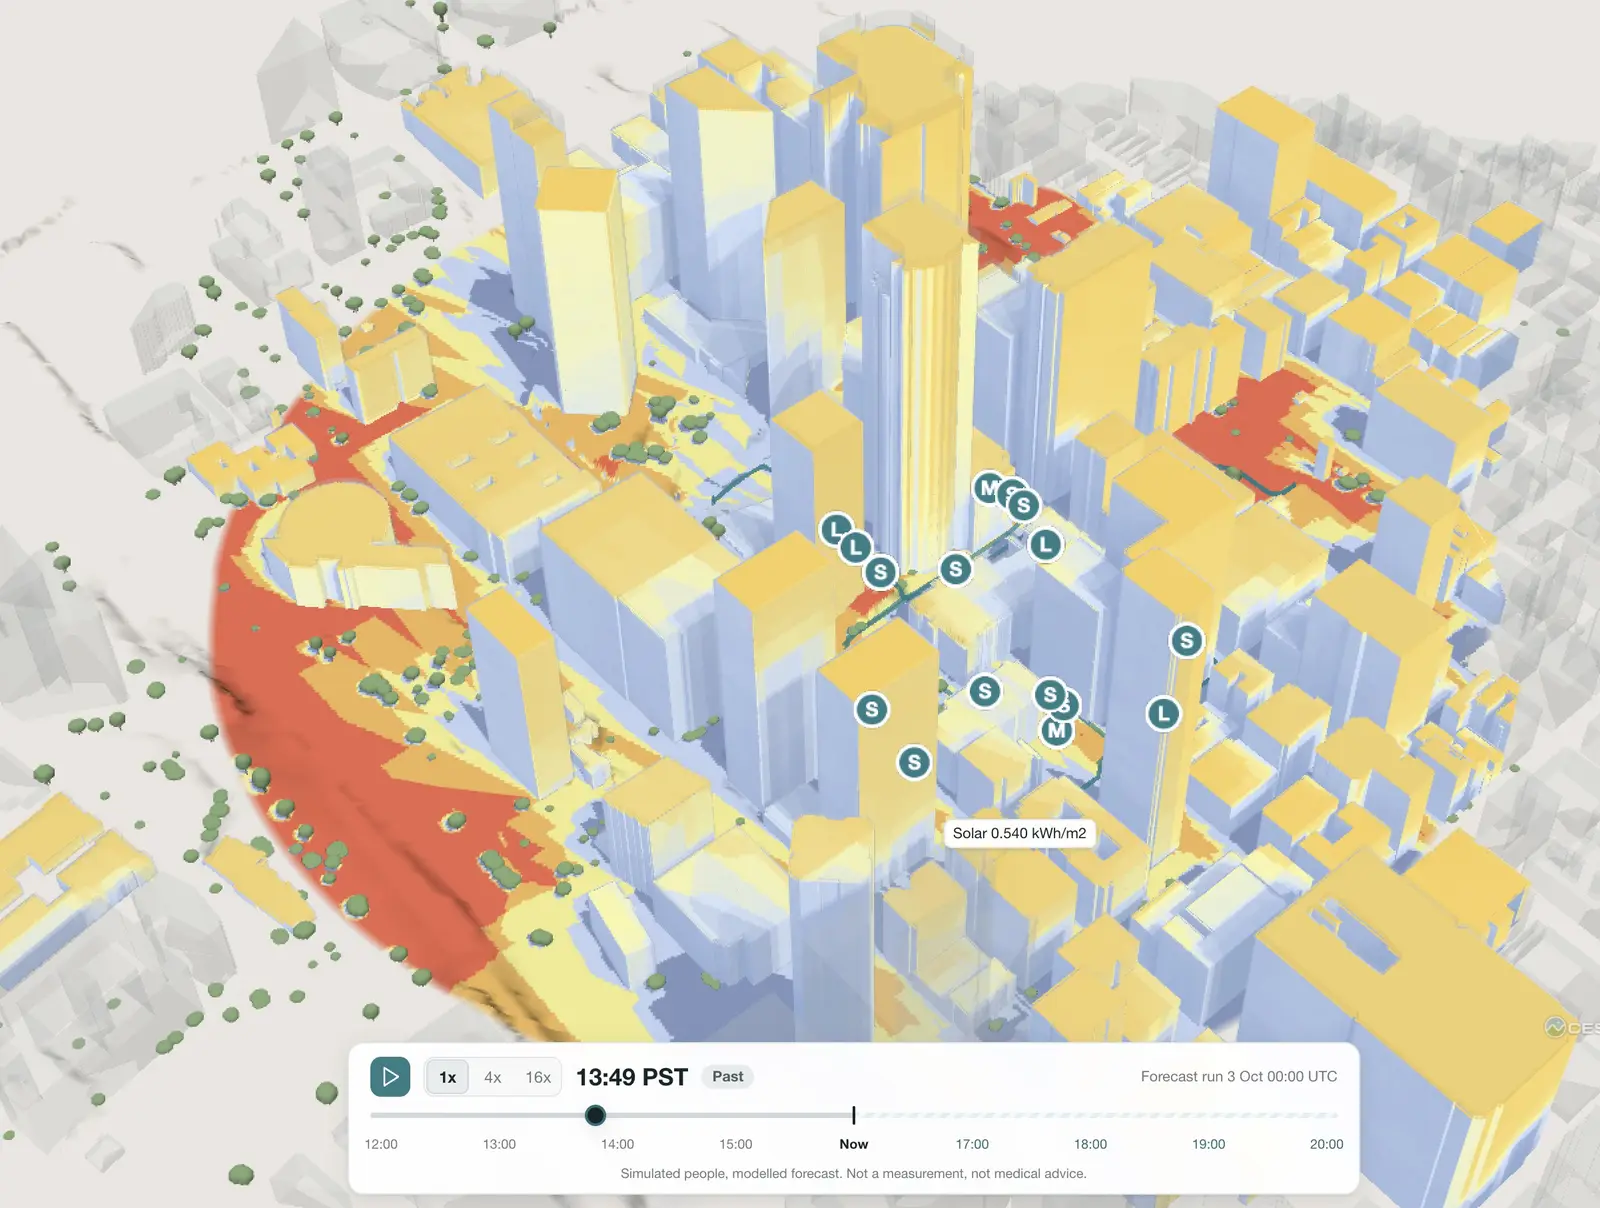
Every value is a time series. You see what each person has taken in since the start of the shift, and what the forecast brings in the next hours.
Play the day back to see where the load came from. Move it forward to see who reaches the limit first, and rotate before it happens, not after.
Events
Marathons, stadiums, festivals and fairs: the heat on a site changes hour by hour. A street in full sun at 2 pm is in shade at 5 pm. A queue on open asphalt is hotter than the stand next to it.
Plan shade, water points, first aid and staff rotation before the day. On the day, the forecast shows where the next hot spots form, so you move teams there before people need help.
Smoke
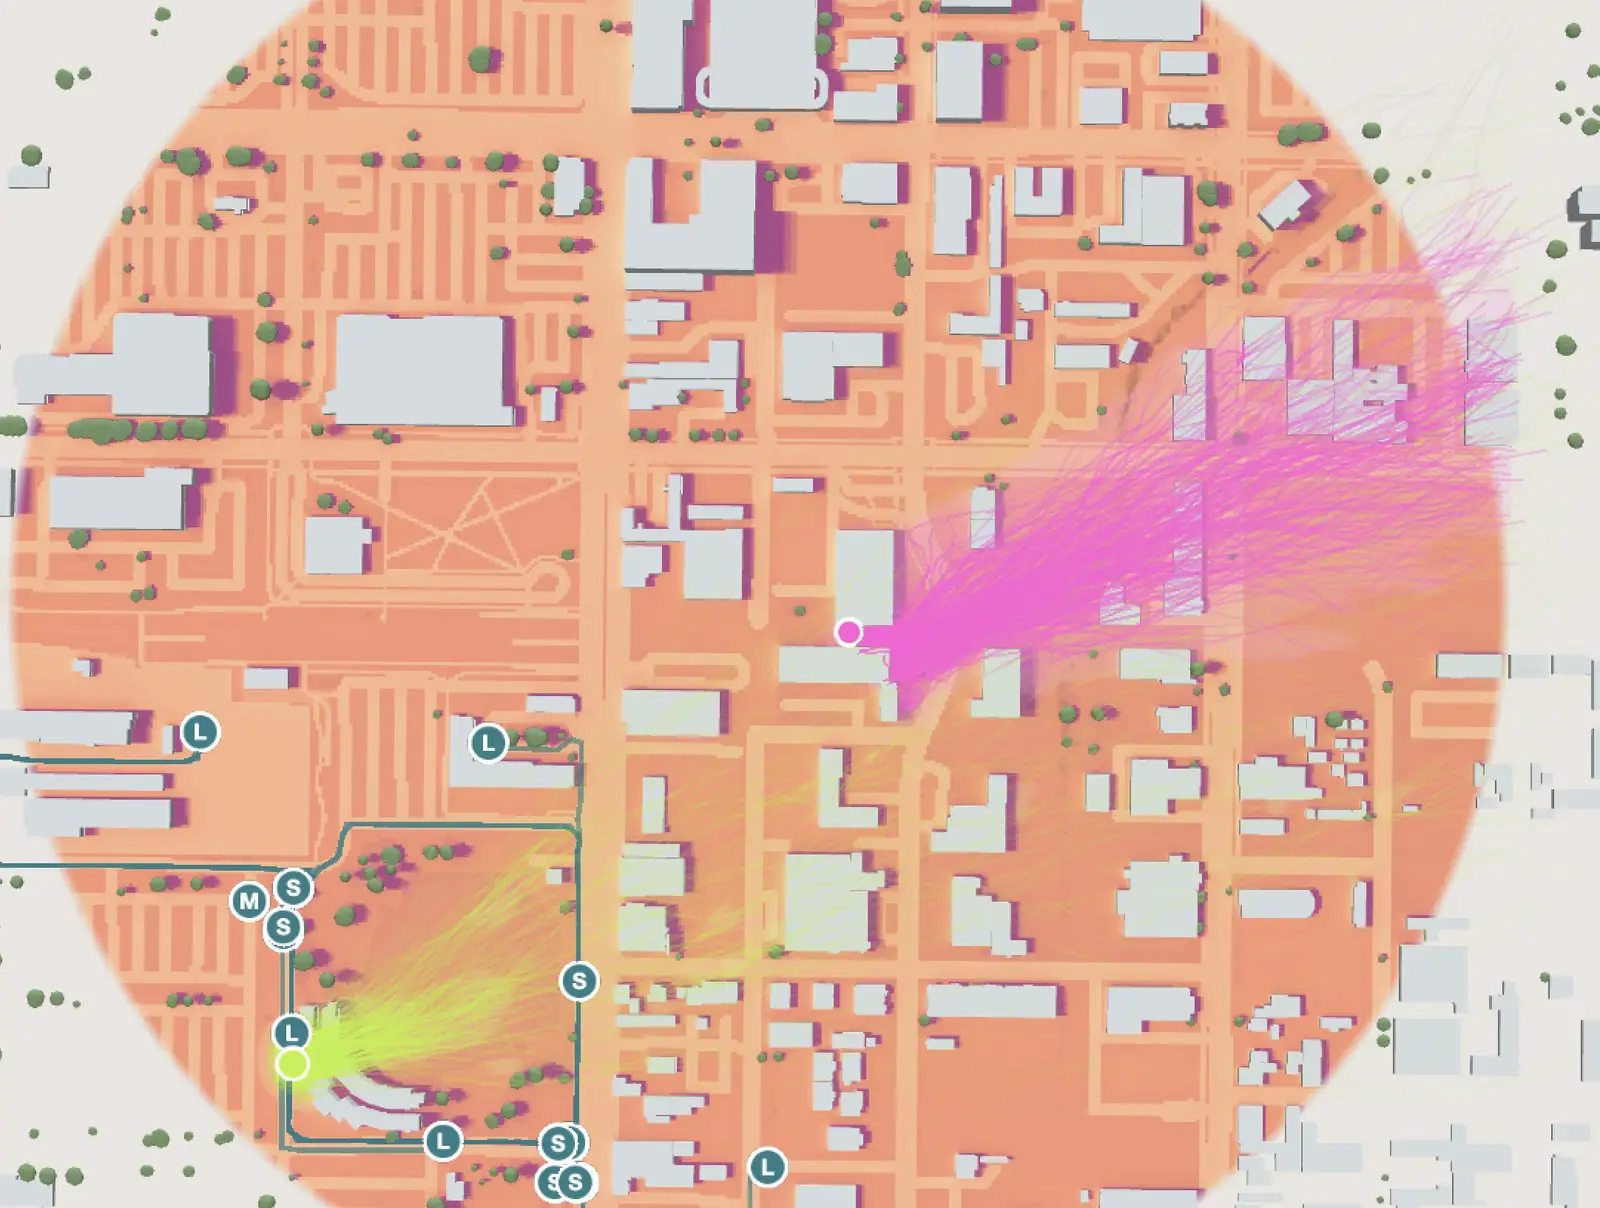
A fire next to a venue, a site or a route: the smoke follows the wind around every building and slope. One wind reading for the whole area does not show this.
Our 3D wind model takes the wind forecast and moves the smoke through the real site. You see which areas and which teams are in it, now and in the next hours. A first run for a new site takes minutes; updates for the same site take seconds.
Sightlines
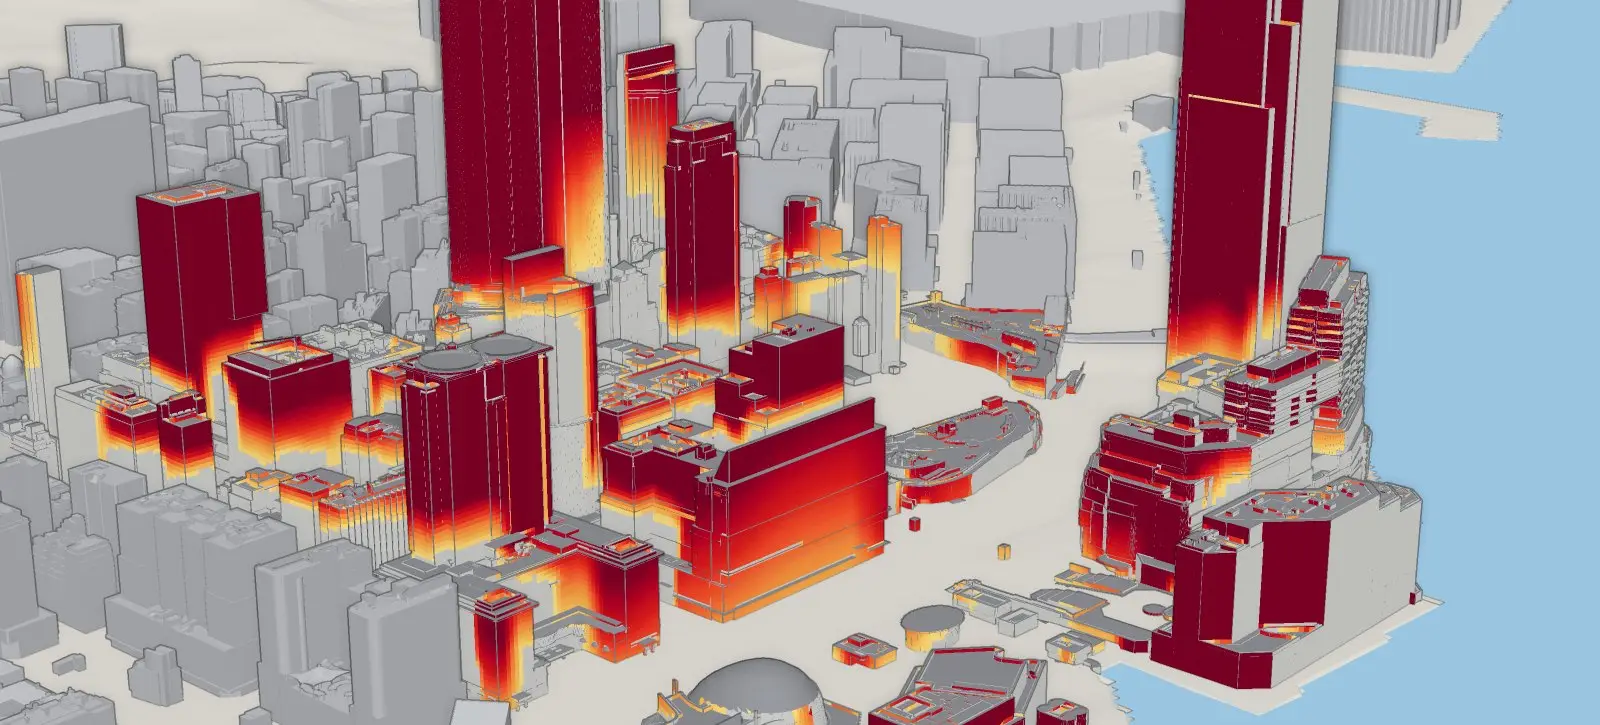
Which places see a given point, and what a team sees from where it stands. Use it for lookouts, cameras, signals and stage views.
Staff, shade and water where the heat builds up, hour by hour.
Heat and smoke exposure for each crew member on the ground.
Patrols, posts and perimeter teams on long outdoor shifts.
Sun, shade and slopes on remote sites, from the forecast.
Routes and tasks planned around the hottest hours.
One map with every team, the climate around them and the next hours.
Rotate crews, set breaks and send water and shade where the heat is, before people overheat.
Simulated security, logistics and engine crews in Los Angeles: felt heat at each position and heat load so far in the shift. Shown here with 3D wind and smoke from three sources: soon, on demand.
Funded and supported by