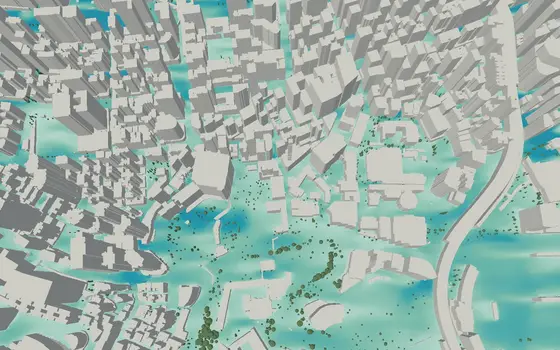
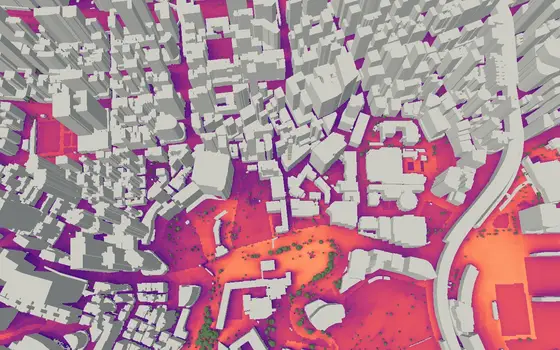
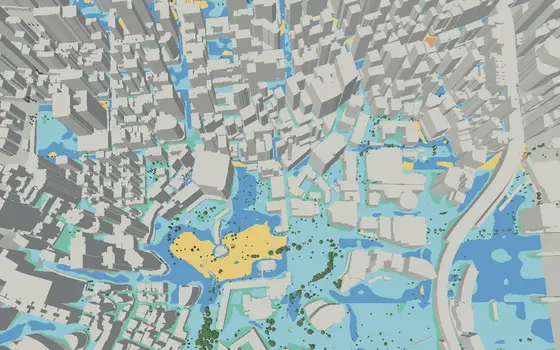
Validation

Every model simplifies. What matters is the right model for the right purpose. We test ours against instruments in the street, against Radiance and EnergyPlus, against CFD, and side by side with PALM-4U.

Last updated

What we test Four reference types

Perceived heat: radiant heat (Tmrt) against street instruments in four cities, and against another model on the same input.Typical error (RMSE) of radiant heat (Tmrt) against street instruments, our result against SOLWEIG (University of Gothenburg research model) on the same input: Gothenburg (4.5 K against 5.0 K), Phoenix (11.1 K against 14.3 K), Melbourne (11.8 K against 12.5 K) and Guelph (9.7 K against 12.3 K). Melbourne and Guelph are held-out sites.

Sun and light: against Radiance. Building energy: against EnergyPlus. Wind: against high-fidelity CFD.

Fast: 400 km² in 44 s

1 km²Vienna · 6,904 buildings · geometry already uploaded 5 s
9 km²Vienna · 28,714 buildings 24 s
100 km²Hamburg · 59,883 buildings 37 s
400 km²Berlin · 318,856 buildings 44 s
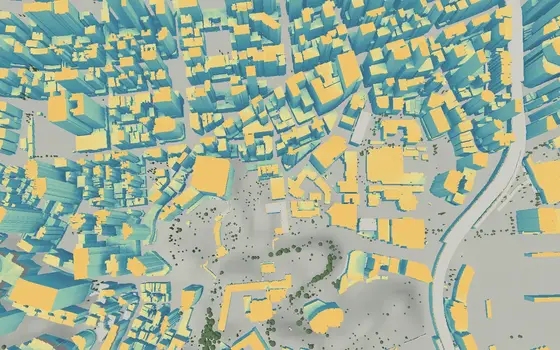
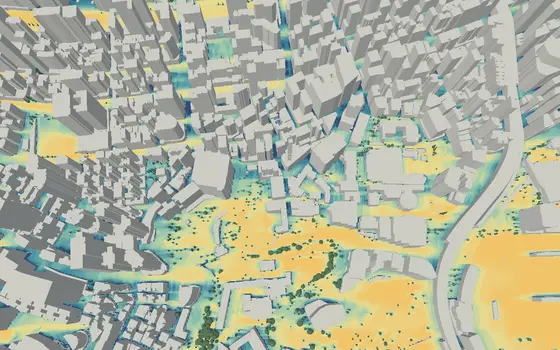
Perceived heat (UTCI), one summer day, 1 m grid, on our production cloud. 1 km²: geometry already uploaded; other rows end to end.

Perceived heat, Guelph Held-out

3.9 K

Perceived heat (UTCI) is within about 4 K of the street measurements.

Radiant heat, Gothenburg Street instruments

4.5 K

Typical error against sensors at 3 sites, 85 hours.

Sun against Radiance

2.6 %

Median difference in solar radiation against Radiance, on a real Vienna tile.

Buildings against EnergyPlus

21/22

ASHRAE 140 (BESTEST) values in the reference band. EnergyPlus 26.1 gets 19 of 22. Design options come out in the same order.

Wind against CFD

0.988

Index of Agreement. Mean absolute error 0.31 m/s against high-fidelity CFD.

Standards we follow

  • Lawson
  • Davenport
  • NEN 8100
  • VDI 3787
  • UTCI

Wind comfort and perceived heat are aligned with these, not certified.

Side by side with PALM-4U

0.92–0.94 r

Tree options rank in the same order as the detailed model (Prague), in seconds instead of about an hour per scenario. Read the technical note (PDF)

Model cards

What each of the 12 models computes, how, and the standards it follows.

Wind speed

Computes
Wind speed in m/s at pedestrian level, for one wind direction.
How
An AI model, trained on CFD results, estimates the wind field from the urban shape. It does not run CFD for each request.
Tested
0.988 Index of Agreement vs CFD
Aligned with
VDI 3787-4

Pedestrian wind comfort

Computes
Comfort and safety classes on a ground grid, over a wind climate.
How
The wind model gives 16 directional wind fields. We combine them with the local wind climate and classify every place to the established criteria: Lawson, NEN 8100, Davenport and VDI 3787. We classify the hourly mean wind speed, not gusts.
Aligned with
Lawson (LDDC), NEN 8100, VDI 3787-4

Thermal comfort

Computes
Percent of the chosen time that each ground cell is in the UTCI comfort band: 9 °C up to, not including, 26 °C.
How
Ray tracing gives sky view and solar radiation. Mean radiant temperature comes from surface temperature, solar and sky view. UTCI combines it with air temperature, humidity and wind: the weather-file wind for every cell, or, in the Advanced with local wind level, local wind for each cell from the AI wind model.
Tested
4 cities radiant heat measured in the street
Aligned with
UTCI, Bröde et al. 2012, VDI 3787-2, VDI 3785-1

Heat stress

Computes
Percent of the chosen time that each ground cell is at UTCI 26 °C or higher (heat stress).
How
The same UTCI engine as thermal comfort. A statistics step counts the hours above the threshold.
Tested
4 cities radiant heat measured in the street
Aligned with
UTCI, Bröde et al. 2012, VDI 3787-2

Cold stress

Computes
Percent of the chosen time that each ground cell is below UTCI 9 °C (cold stress).
How
The same UTCI engine as thermal comfort. A statistics step counts the hours below the threshold.
Tested
4 cities radiant heat measured in the street
Aligned with
UTCI, Bröde et al. 2012, VDI 3787-2

Microclimate (UTCI)

Computes
UTCI in degrees C on a ground grid, at a chosen time or time window.
How
Ray tracing gives the radiation. Mean radiant temperature and the weather data give the UTCI value.
Tested
4 cities radiant heat measured in the street
Aligned with
UTCI, Bröde et al. 2012, VDI 3787-2, VDI 3787-8

Daylight availability

Computes
A direct-sun score from 0 to 100 percent, for a point or a surface.
How
Ray tracing follows the sun positions that nothing blocks. The score reaches 100 percent at half of the maximum possible sun access.
Tested
Same values as Radiance
Aligned with
Perez all-weather sky, EN 17037

Sky view factors

Computes
The visible sky, from 0 to 100 percent, at each point or surface.
How
A hemispherical ray trace samples the sky directions that are visible.
Tested
0.7 pt median difference vs Radiance
Aligned with
VDI 3787-1

Direct sun hours

Computes
Hours of direct sun at each point or surface, over a chosen period.
How
Ray tracing checks each chosen sun position for shade and adds up the hours.
Tested
Same hours as Radiance, at every test point
Aligned with
EN 17037 sunlight exposure

Solar radiation

Computes
Solar energy in kWh/m2 on ground, facade and roof surfaces.
How
A sky matrix built from the direct and diffuse radiation of the weather file. Ray tracing finds the shade and the sky exposure of each surface, and the light that facades reflect, from each building's material.
Tested
2.6 % median difference vs Radiance
Aligned with
ISO 52010-1, VDI 3789-2, Perez all-weather sky

Interior daylight factor

Computes
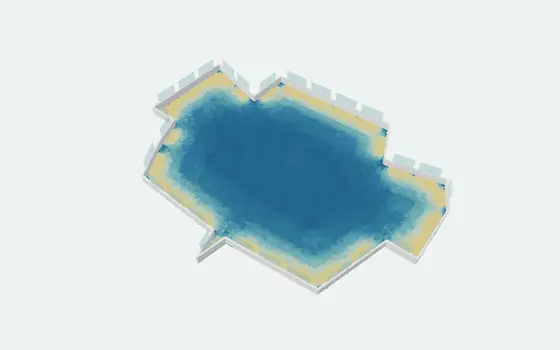
Daylight factor in percent at points inside a room.
How
A CIE standard overcast sky. Ray tracing follows the light through the openings.
Tested
0.4 pt median difference vs Radiance
Aligned with
CIE standard sky (ISO 15469), EN 17037

Energy balance

Computes
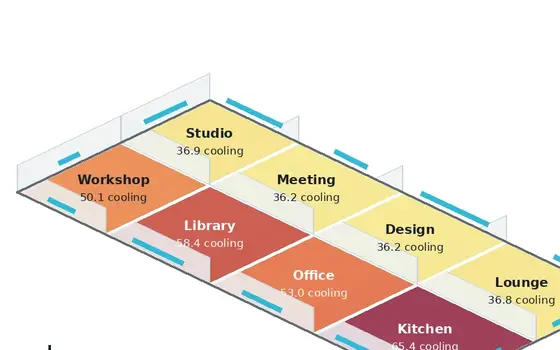
Hourly heating and cooling need per zone and per month, and the annual energy need in kWh/m2 per year.
How
An hourly energy-need calculation to ISO 13790 (one thermal mass node per zone), with zones, solar gains and shade from the real site: buildings, trees, terrain and installations. A monthly method is available for speed.
Tested
21/22 ASHRAE 140 tests in the reference band (EnergyPlus: 19)
Aligned with
ISO 13790 hourly (Annex C) and monthly methods, EN 15265 test cases, ASHRAE 140 (BESTEST), ISO 6946, ISO 13370

3D wind (CFD) Preview

Computes
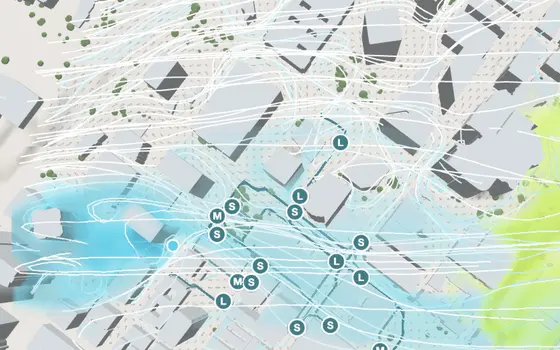
The full 3D wind field around buildings and trees, on 1 to 3 m cells: wind speed at any height, flow lines, and where smoke goes.
How
A GPU lattice Boltzmann solver runs the flow for each wind direction, from the forecast or a chosen wind. A new site takes about 5 minutes; updates for the same site take seconds.
Tested
5 of 5 VDI 3783-9 test cases meet the hit-rate bar on every wind component
Aligned with
VDI 3783-9 test cases C1 to C5, AIJ wind-tunnel benchmarks
Model card (PDF)

All sites and method

Every number above, with the full context.

Perceived heat: four citiesRadiant heat (Tmrt) against street instruments, and the reference data

Radiant heat (Tmrt)

Typical error (RMSE) in K against field instruments. Lower is better.

Typical error (RMSE, kelvin, lower is better). Gothenburg 4.5 K against 5 K (in-sample); Phoenix 11.1 K against 14.3 K (in-sample); Melbourne 11.8 K against 12.5 K (held-out); Guelph 9.7 K against 12.3 K (held-out). 0 5 10 15 4.5 5.0 Gothenburg in-sample 11.1 14.3 Phoenix in-sample 11.8 12.5 Melbourne held-out 9.7 12.3 Guelph held-out
InfraredOther modelSOLWEIG (University of Gothenburg research model), same input: Gothenburg 4.5 vs 5 K, Phoenix 11.1 vs 14.3 K, Melbourne 11.8 vs 12.5 K, Guelph 9.7 vs 12.3 K. Source: infrared.city internal validation report (Oct 2026), available on request. Same points, weather and 3D scene for both models. Lighter bars: in-sample sites.

Phoenix and Gothenburg are in-sample: we used the data while we built the engine. Melbourne and Guelph are held-out sites: we changed no setting for them. Method: Thermal model method.

The reference data

SiteInstrumentSample
Gothenburg, SwedenSix-direction sensors3 sites, 85 hours
Phoenix / Tempe, USAMaRTy cart (six-direction sensors)One park, 438 points, summer days
Melbourne, AustraliaGlobe thermometers3 courtyards, 989 points
Guelph, CanadaMaRTy cart9 sites, 140 points

For each measured point and hour, we read the model cell at that place. The weather is the measured weather of the test days. Error is model minus measured. We report the typical error (RMSE). The Gothenburg value is a mix of three sites. We tested the engine as it was on 23 October 2026.

Sun and light: against RadianceSolar radiation, sky view, sun hours and daylight

We compare our results point by point with Radiance 6.1, the open-source lighting simulation from Lawrence Berkeley National Laboratory and a standard tool for light and solar studies. Both tools get the same geometry, materials, sky and sun positions.

ModelTest scenesResult
Solar radiationStreet canyons (height to width 0.5 to 3), a courtyard, an open square with a tall bright tower, a low building, real tiles of Vienna and Hong Kong. Glass, white render, dark brick and concrete facades. Radiance with 8 reflectionsMedian difference 2.6 % (Vienna) and 4.5 % (Hong Kong). Per street case 0.1 to 7 %, deep sunny canyons 2 to 7 %
Sky view factorStreet canyons and a Vienna tile with 119 points. Cosine-weighted, the same definition in both toolsMedian difference 0.6 to 0.7 points, correlation 0.997
Direct sun hoursOne June day and one June month, Vienna and Hong Kong latitudes, 20 points per caseThe same hours at all 20 test points of each case
Daylight availabilityThe same scenes and periods as direct sun hoursMatches Radiance on the same scenes and sun positions
Daylight factorCIE overcast sky. Side-lit 4 × 6 m room and deep 4 × 12 m room, wall reflectance 0.5 and 0.7. Radiance with 6 reflectionsMedian difference 0.3 to 0.4 percentage points. Side-lit rooms read slightly high: 3.7 % against 3.2 %

Facade materials set the light that walls reflect onto the street. We also check the energy balance: the light that arrives, is absorbed and leaves adds up (ratio 0.98 to 1.00). For scale: a good field pyranometer has an uncertainty of about ±4 %, a typical weather file 5 to 10 %. Tests run 27 to 29 October 2026.

Buildings: against EnergyPlusRank correlation 0.98 to 0.99 on the BESTEST buildings

We compare the building energy model with EnergyPlus, the reference tool of the US Department of Energy, on the standard BESTEST test buildings, and test it to the European standard EN 15265.

Design variants rank in the same order as in EnergyPlus: rank correlation 0.98 to 0.99. That is what early design decisions need. Absolute heating plus cooling is 8 to 15 % above EnergyPlus. To EN 15265 the model reaches level C or better in 4 of 4 continuous and 3 of 8 intermittent cases. The monthly method follows ISO 13790 and reproduces all 12 monthly values of its worked example (Annex J) exactly. The hourly method follows Annex C of the same standard. Tests run in September 2026.

Wind: the AI modelIndex of Agreement 0.988, mean absolute error 0.31 m/s

The wind model is an AI model that we trained on CFD results. We tested it against high-fidelity CFD simulations of many urban shapes: Index of Agreement 0.988 (1.0 is a perfect match) and a mean absolute error of 0.31 m/s. The full text is in the article Wind model validation.

3D CFD on request for strong-wind cases. If a project needs more than screening, talk to us.