Demo
Digital twin demo
A live forecast of sun and heat load on the facades and roofs of a tower and the ground around it. It shows the load on every facade, hour by hour.
 Platform Book a call
Hour by hour, see how much sun and heat each facade and roof of your buildings takes, now and for the next days, so you can plan cooling and maintenance spend.
Sun and heat load on every facade and roof, hourly, for the next days.
Heat does not hit a building evenly. One facade takes the afternoon sun, another stays in shade, and the roof takes the most all day. A single weather reading for the site hides this.
infrared.city prepares your building and its surroundings once, facades, roofs and ground. Then the live weather and the forecast flow in. You see the sun and heat load on every facade for every hour of the next days, and for past seasons. Operators use it to plan cooling and maintenance around where and when heat hits the building.
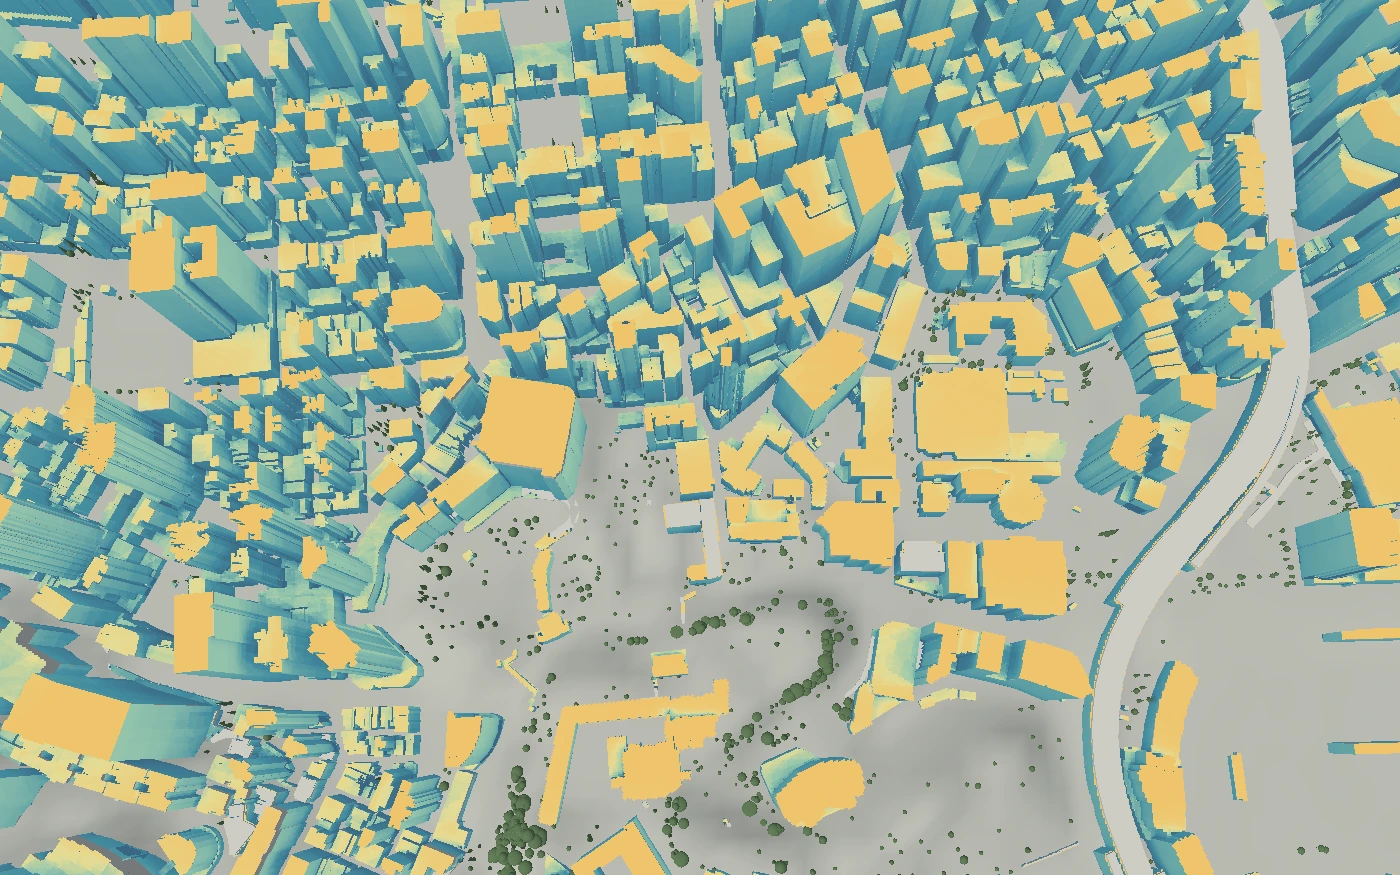
See the heat load on each facade for the coming days, before you set cooling.
A live forecast of sun and heat load on the facades and roofs of a tower and the ground around it. It shows the load on every facade, hour by hour.
Funded and supported by