Paying client
City of Luleå
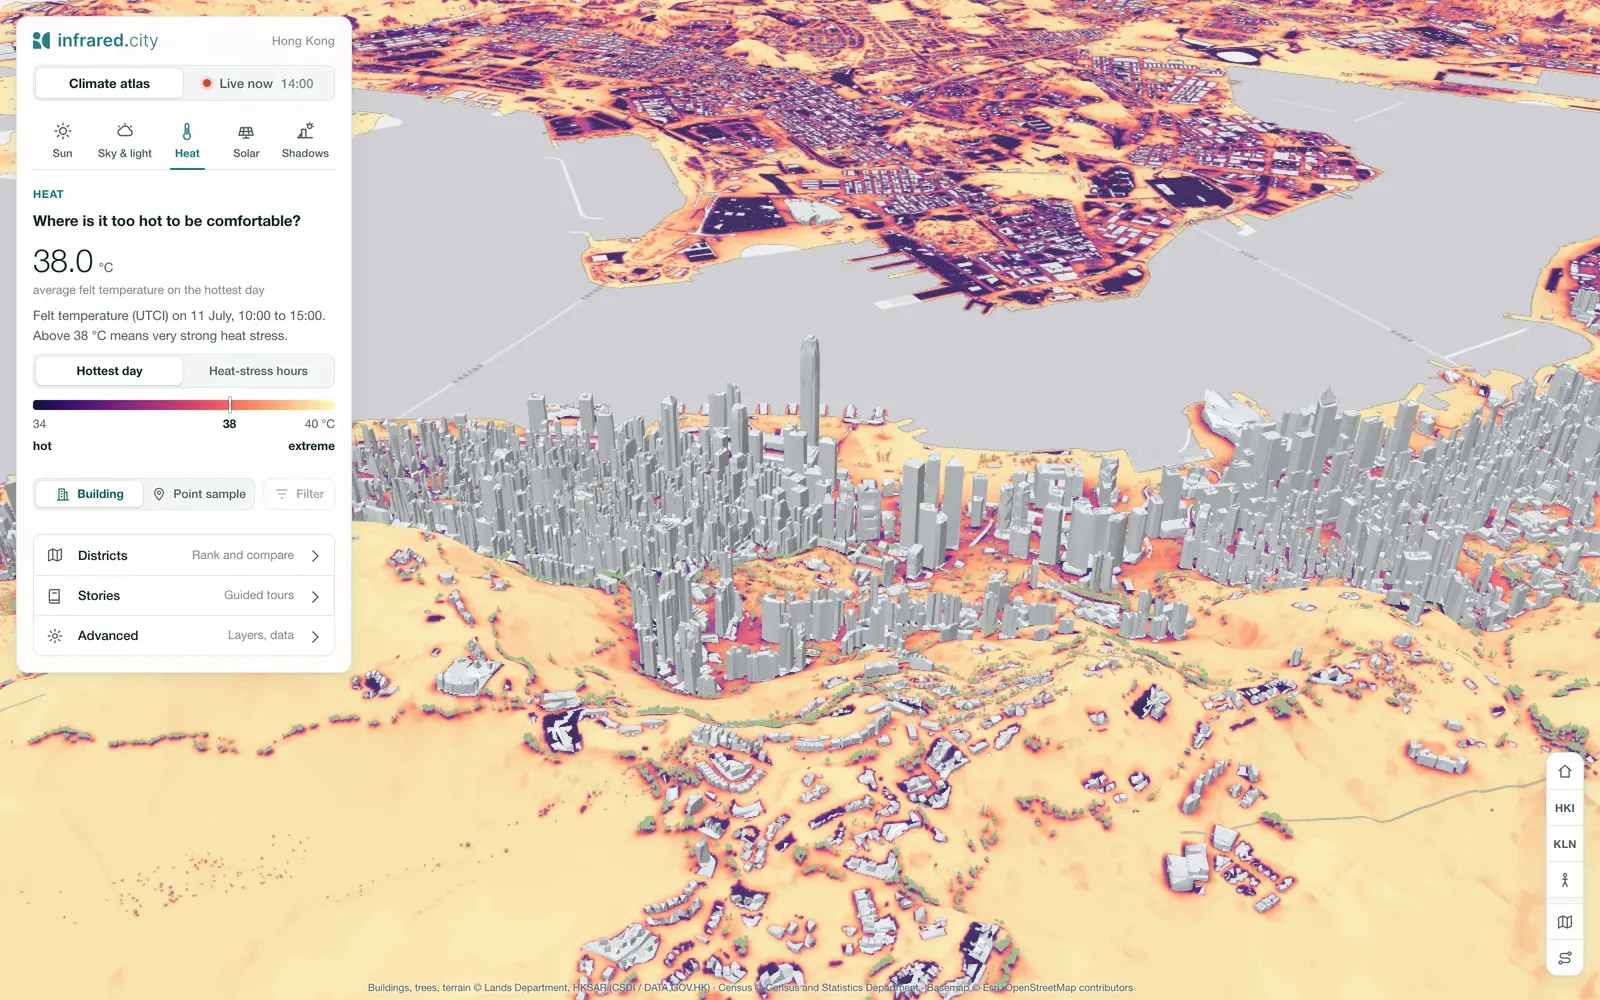
runs its live layer for ice risk and a heat risk index. The image shows the Hong Kong example project.
 Platform Book a call
A live climate data layer for your city or twin. Ask it about heat, wind, shade and sun on every street and facade: on a map, in your twin, or through an API.
Sensors and city averages miss the hottest streets. The live layer covers every one of them.
Weather stations measure a few points. A city average hides the streets with no shade, little wind and hot surfaces, where heat stress is highest.
It runs the same physics as the API on a model of your city that we set up once, ground and facades. Live weather and the forecast then drive it.
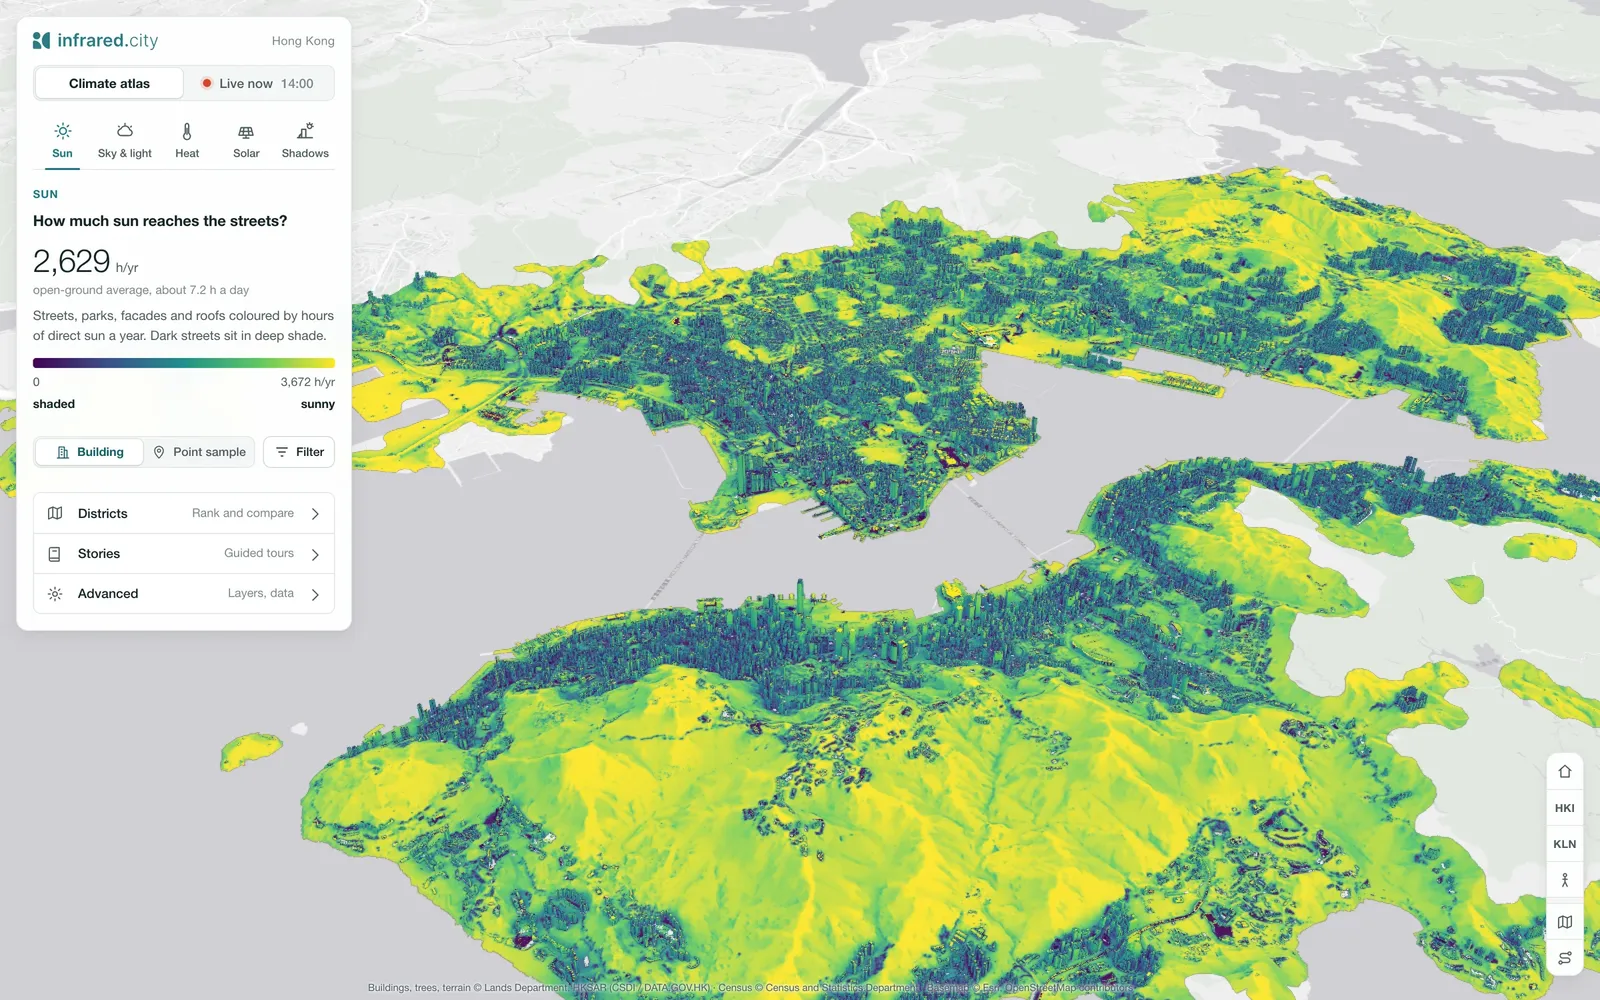
Sensors tell you what is happening now. The live layer forecasts what comes next, on every street, even where no sensor stands.
Send plough crews where ice forms first.
Warn people and open cooling spots before the heat peaks.
Shade-aware and heat-aware routes in transport and walking apps.
Plan shade, water and staff, hour by hour.
Place ambulances where heat stress will peak.
Forecast the sun load on critical buildings.
What-if
Test tree planting, greening and surface changes against today, before you commit the budget. Add trees, shade or a new building, and see the effect on felt heat and wind in seconds, before anything is built.
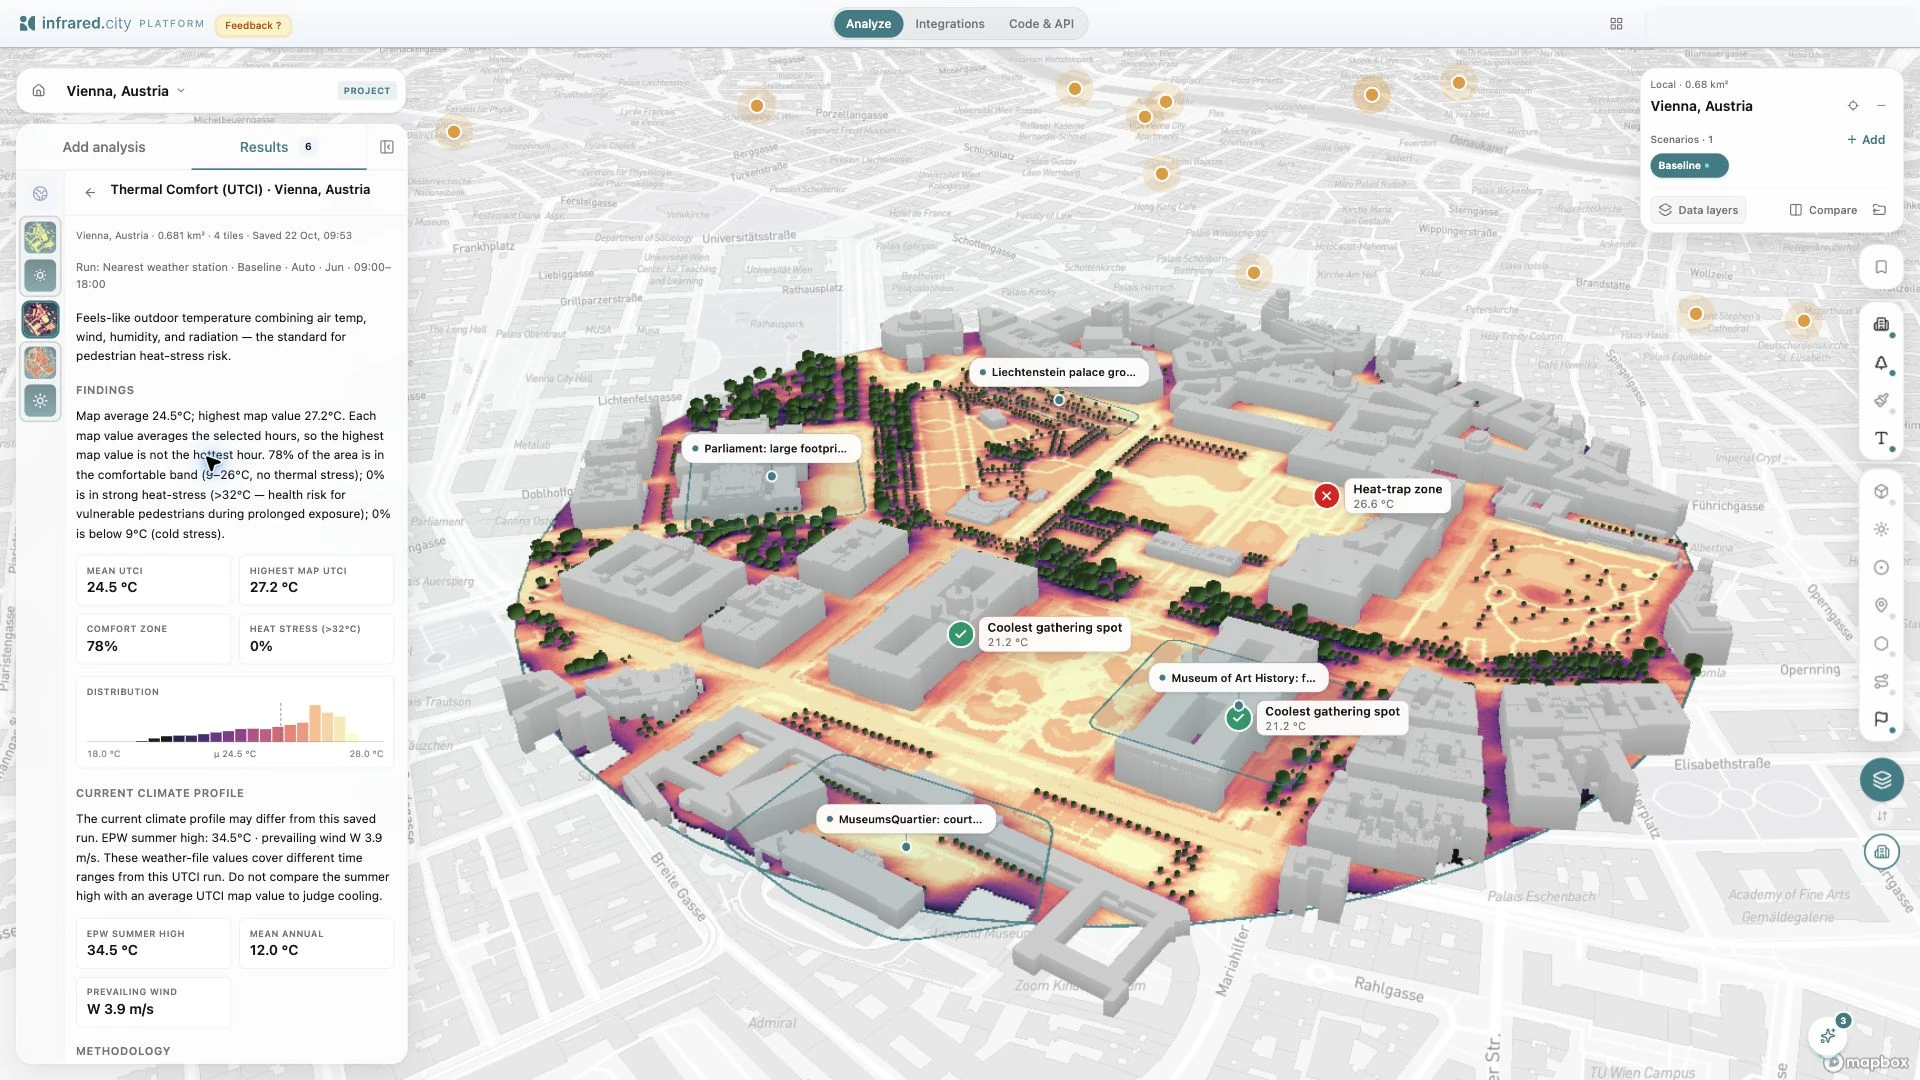
See where heat will hit before it arrives, and decide where to act first.
runs its live layer for ice risk and a heat risk index. The image shows the Hong Kong example project.
Funded and supported by