
A district classified from temperature data
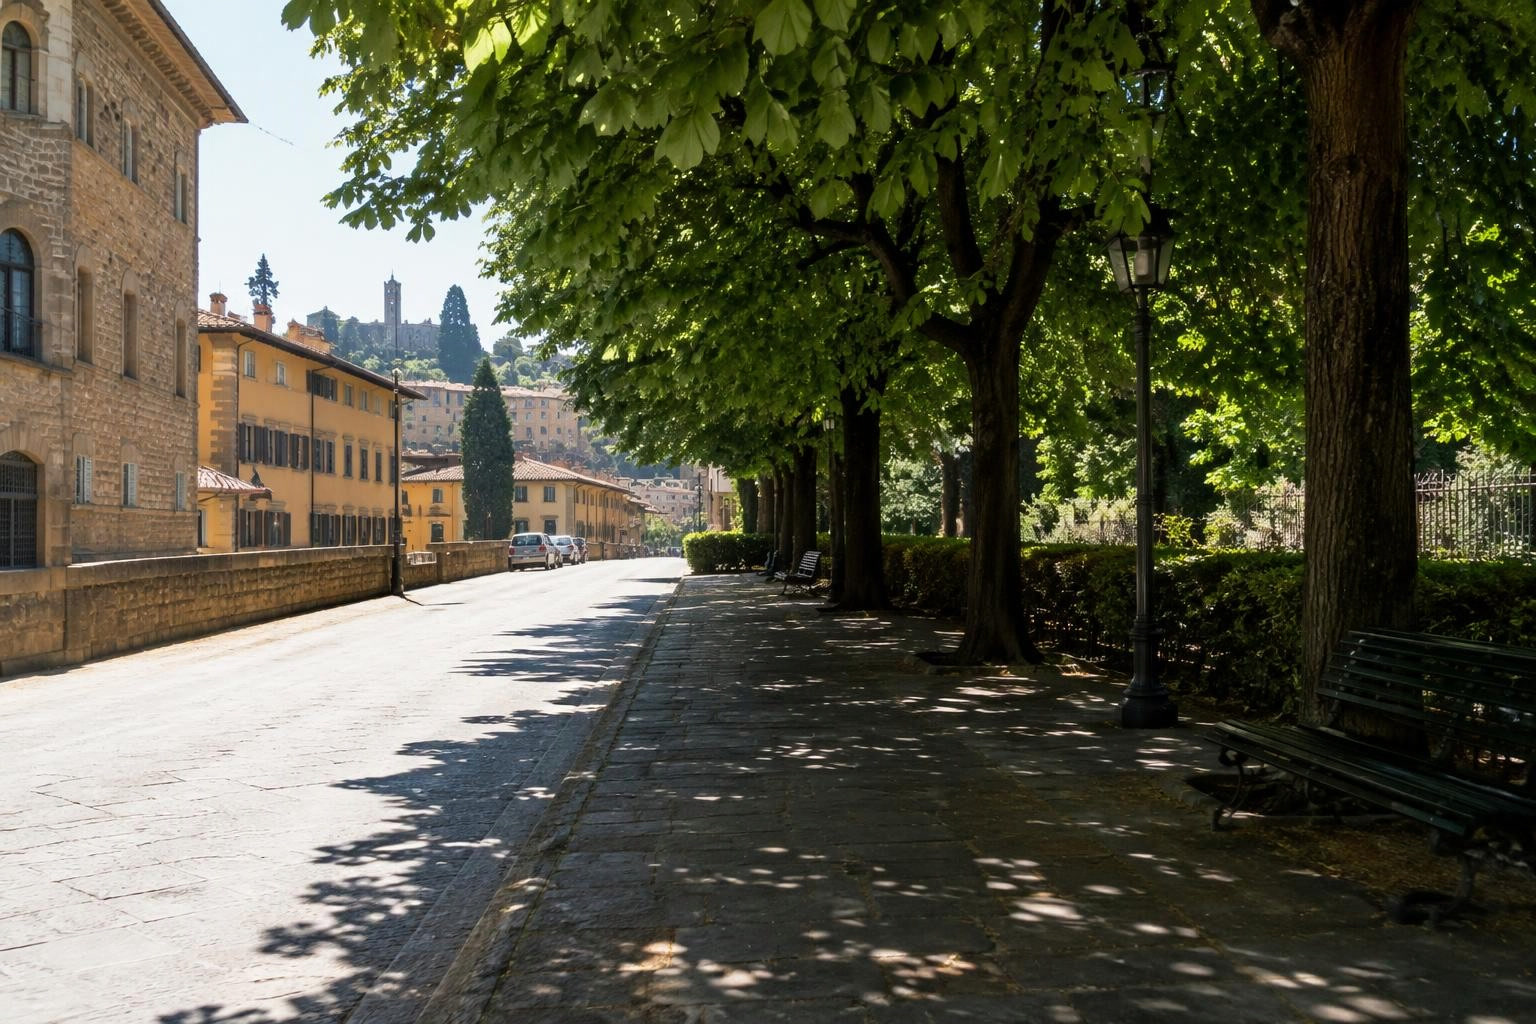
Researchers used unsupervised machine learning to classify urban thermal environments in Florence, Italy. Their input was high-resolution pedestrian-level Mean Radiant Temperature time series.
The study covered a 5.5-square-kilometer area in the north-west of the city. It analyzed 96 hours of temperature data for about four million grid cells.
For software teams, the interesting choice is the input: temperature sequences rather than a single temperature value. The case suggests an interface that lets planners inspect thermal patterns across a period, not only a snapshot.
Keep classification and comfort distinct
A heat app could show a district classification beside the values used to create it. A planner could select a location and inspect its temperature sequence. This would connect the summary view to the underlying data.
Design testing asks a different question: what changes when a planner adds shade or trees? A classification of the existing district could help frame that question. Simulation could then test the proposed layout.
The metric needs a clear label. The Florence study used Mean Radiant Temperature. Thermal comfort models in the infrared.city Simulation library use UTCI. Infrared Core combines radiant temperature with air temperature, humidity and wind to calculate UTCI. An app should present these as distinct measures.
Test the layout behind the heat pattern
A software team could use Infrared Core to add design testing beside a district classification view. Thermal comfort simulation shows the share of the selected period that each ground cell stays within the UTCI comfort band. Heat stress simulation shows the share above the heat-stress threshold.
For a selected pedestrian space, a planner could compare the existing layout with proposed trees or shade structures. The weather, period and settings would stay the same. The decision would be specific: which layout improves comfort where people wait or walk?
The API and SDK support these analyses from Python or TypeScript. Developers can display the results in their own interface. The Build an app recipes include an area-selection and results-map example. That provides a starting point for connecting a district heat view with a testable design choice.
Sources
- BIOENGINEER , accessed 10 Nov 2026.