
From city geometry to a climate question
A common question in our conversations is how to add microclimate to a city digital twin. The practical version is more specific: where will people face heat tomorrow, and at what hour?
For a city team planning an outdoor event, the useful result would show conditions along the route and at waiting areas. Staff could use it to assess where to place shade and water. Planners could test a different layout before choosing it.
infrared.city provides a live climate layer for these questions. It adds simulated heat, wind, shade and sun to the city or twin the team already uses. The dataset can be queried by place and hour.
Heat at the places where people wait
Infrared Core computes microclimate as UTCI on an outdoor ground grid. The calculation uses weather and the scene, including buildings, trees, shade structures and materials. UTCI combines air temperature, humidity, wind and radiant heat.
For the event example, a city engineer could inspect UTCI at a gathering area during the planned opening hours. A direct-sun-hours result could show how long that area receives direct sunlight. Heat-stress statistics could show the share of a selected period above the chosen threshold. These outputs answer different questions in the simulation library.
The team could then compare the existing layout with added shade. Keeping the weather, period and settings the same would make the change in simulated conditions clear. This supports a layout decision rather than a choice based only on the appearance of the model.
Results inside the existing twin
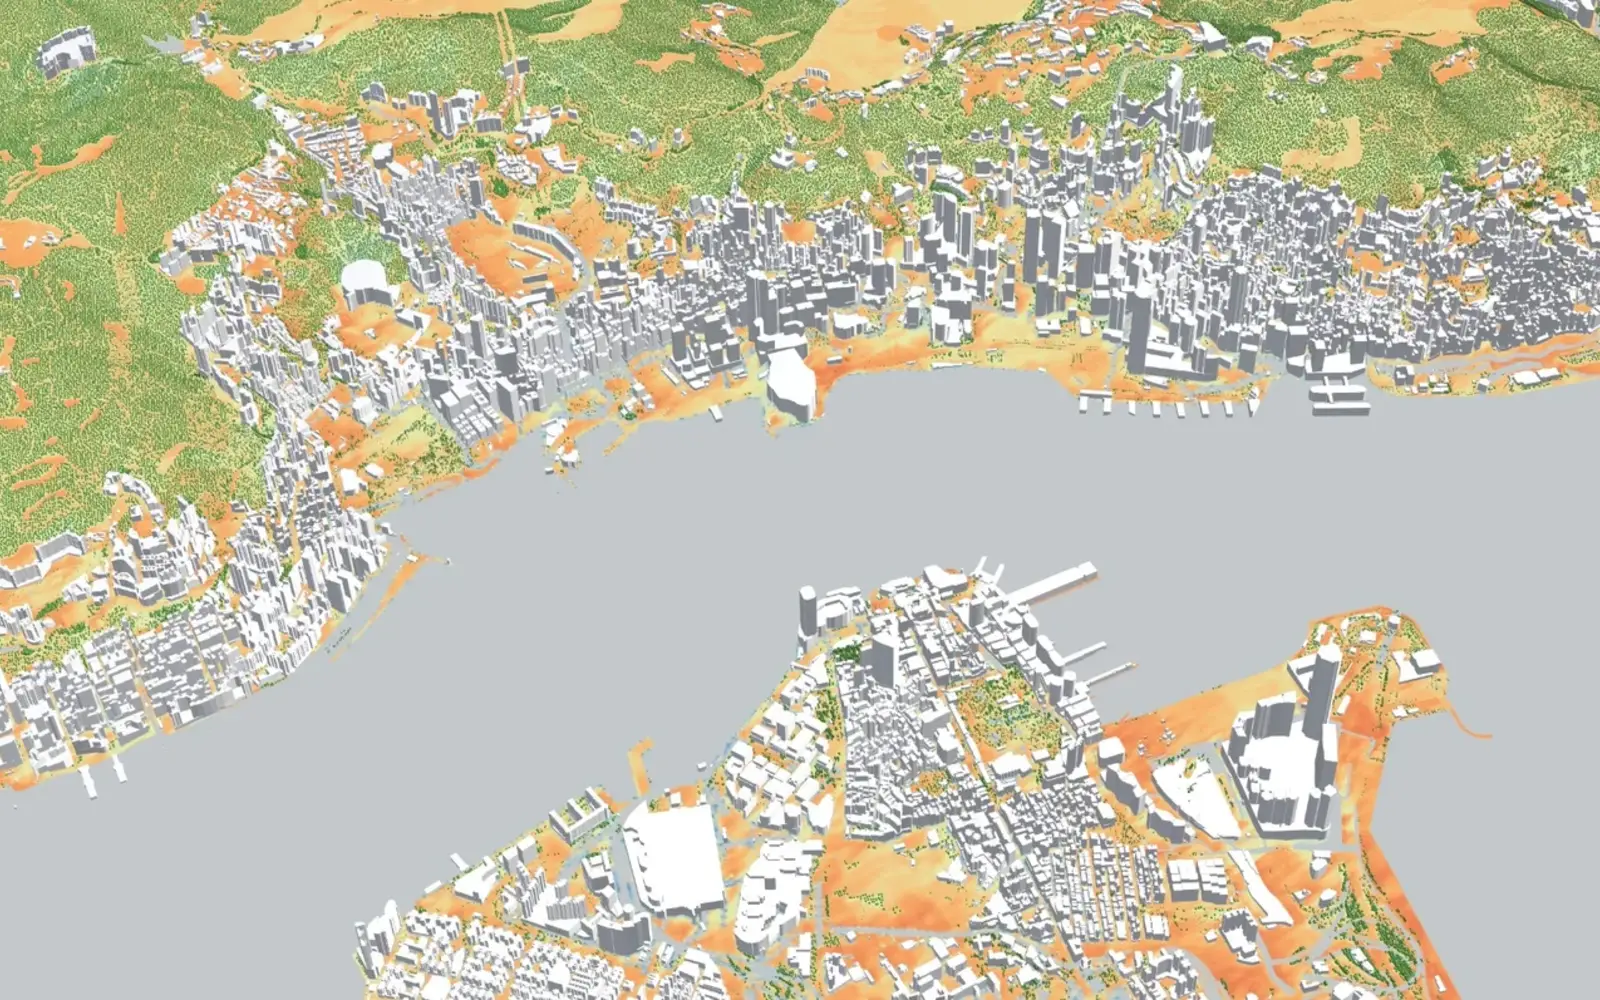
The live layer uses forecast-driven updates for the coming days. It exports results as 3D Tiles, map tiles and data. A city can display them in its existing twin, GIS or dashboard.
Software teams can use the API and SDK to run simulations from Python or TypeScript. The live dataset also supports queries by location and hour.
For the event team, the design comparison and the forecast serve separate purposes. The comparison helps select the layout. The forecast helps plan operations for the expected conditions. Both use Infrared Core.
Sources
- infrared.city validation , accessed 6 Nov 2026.