Climate Intelligence at City Scale
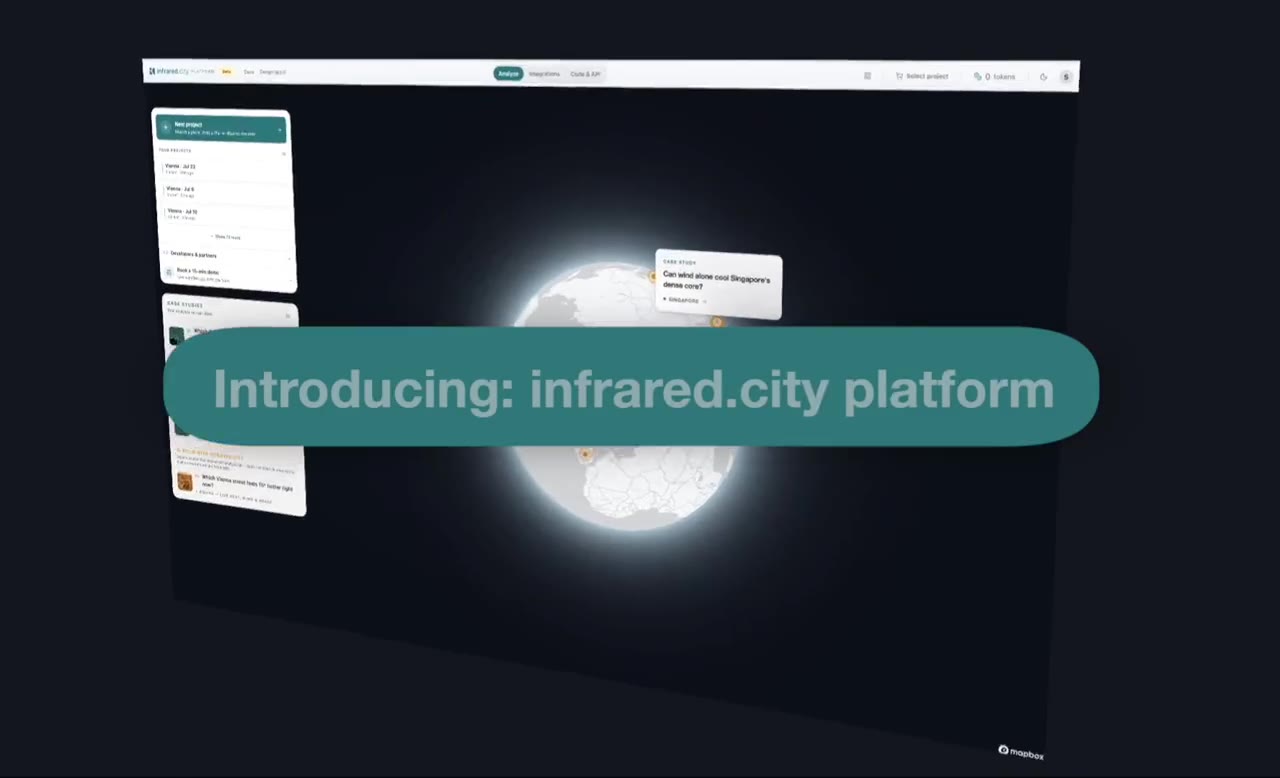
Introducing the Infrared Platform — join the first full live tour. We'll run combined climate workflows on a real city block and read the results as one picture.
- €90
- Free credits to sign up
- 90 min
- Live tour
- Online
- Free to join
- 8
- Analysis types
What You'll Learn
-
Combined workflows
How multiple validated analyses bundle around one goal and merge into a single ranked read of the site.
-
Decision-ready reports
How to turn raw fields into reports that map straight to design and planning decisions.
-
AI assistant & scenarios
How the AI site assistant, scenario comparison, and bring-your-own-data fit a real design process.
-
SDK & API
How to build infrared.city simulations into your own stack through the SDK and API.
One analysis rarely tells the whole story
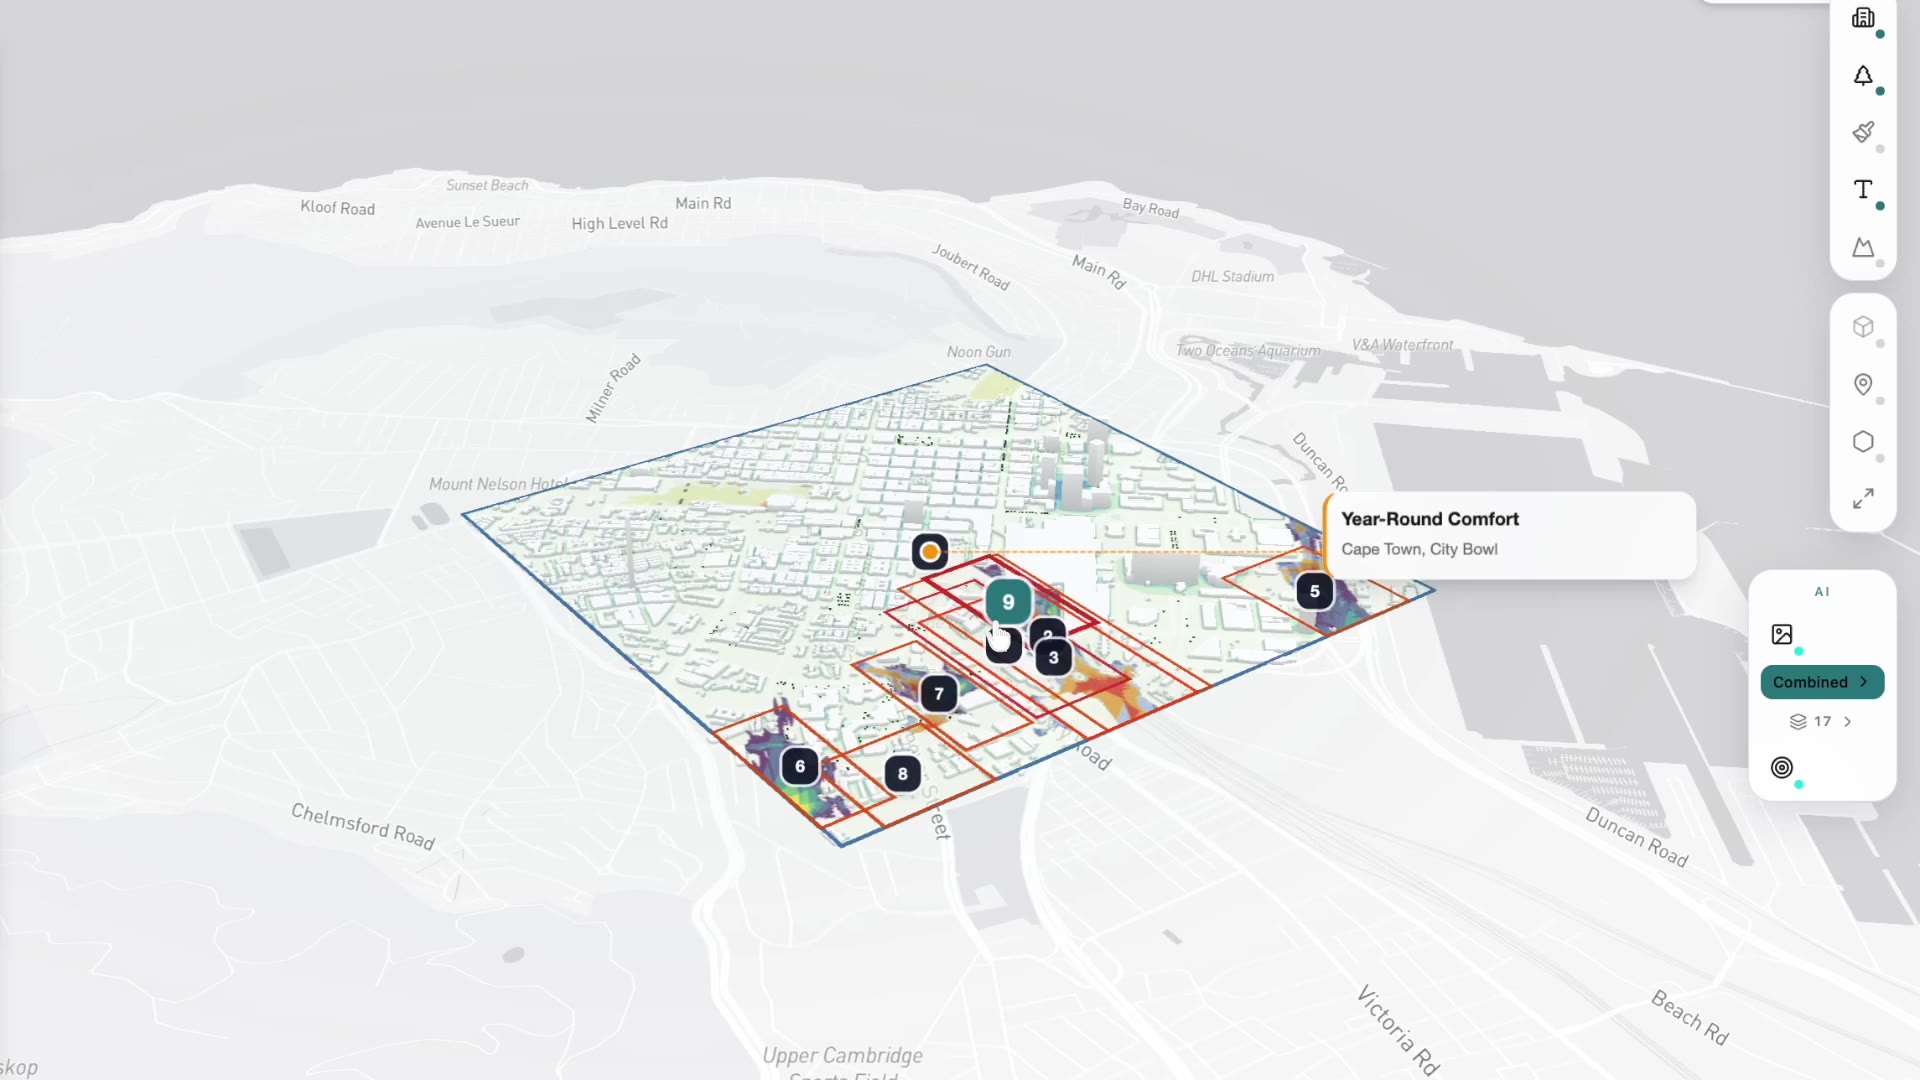
Real climate questions need several analyses — run together and read as one ranked picture of the site.
- Plain-language executive summary
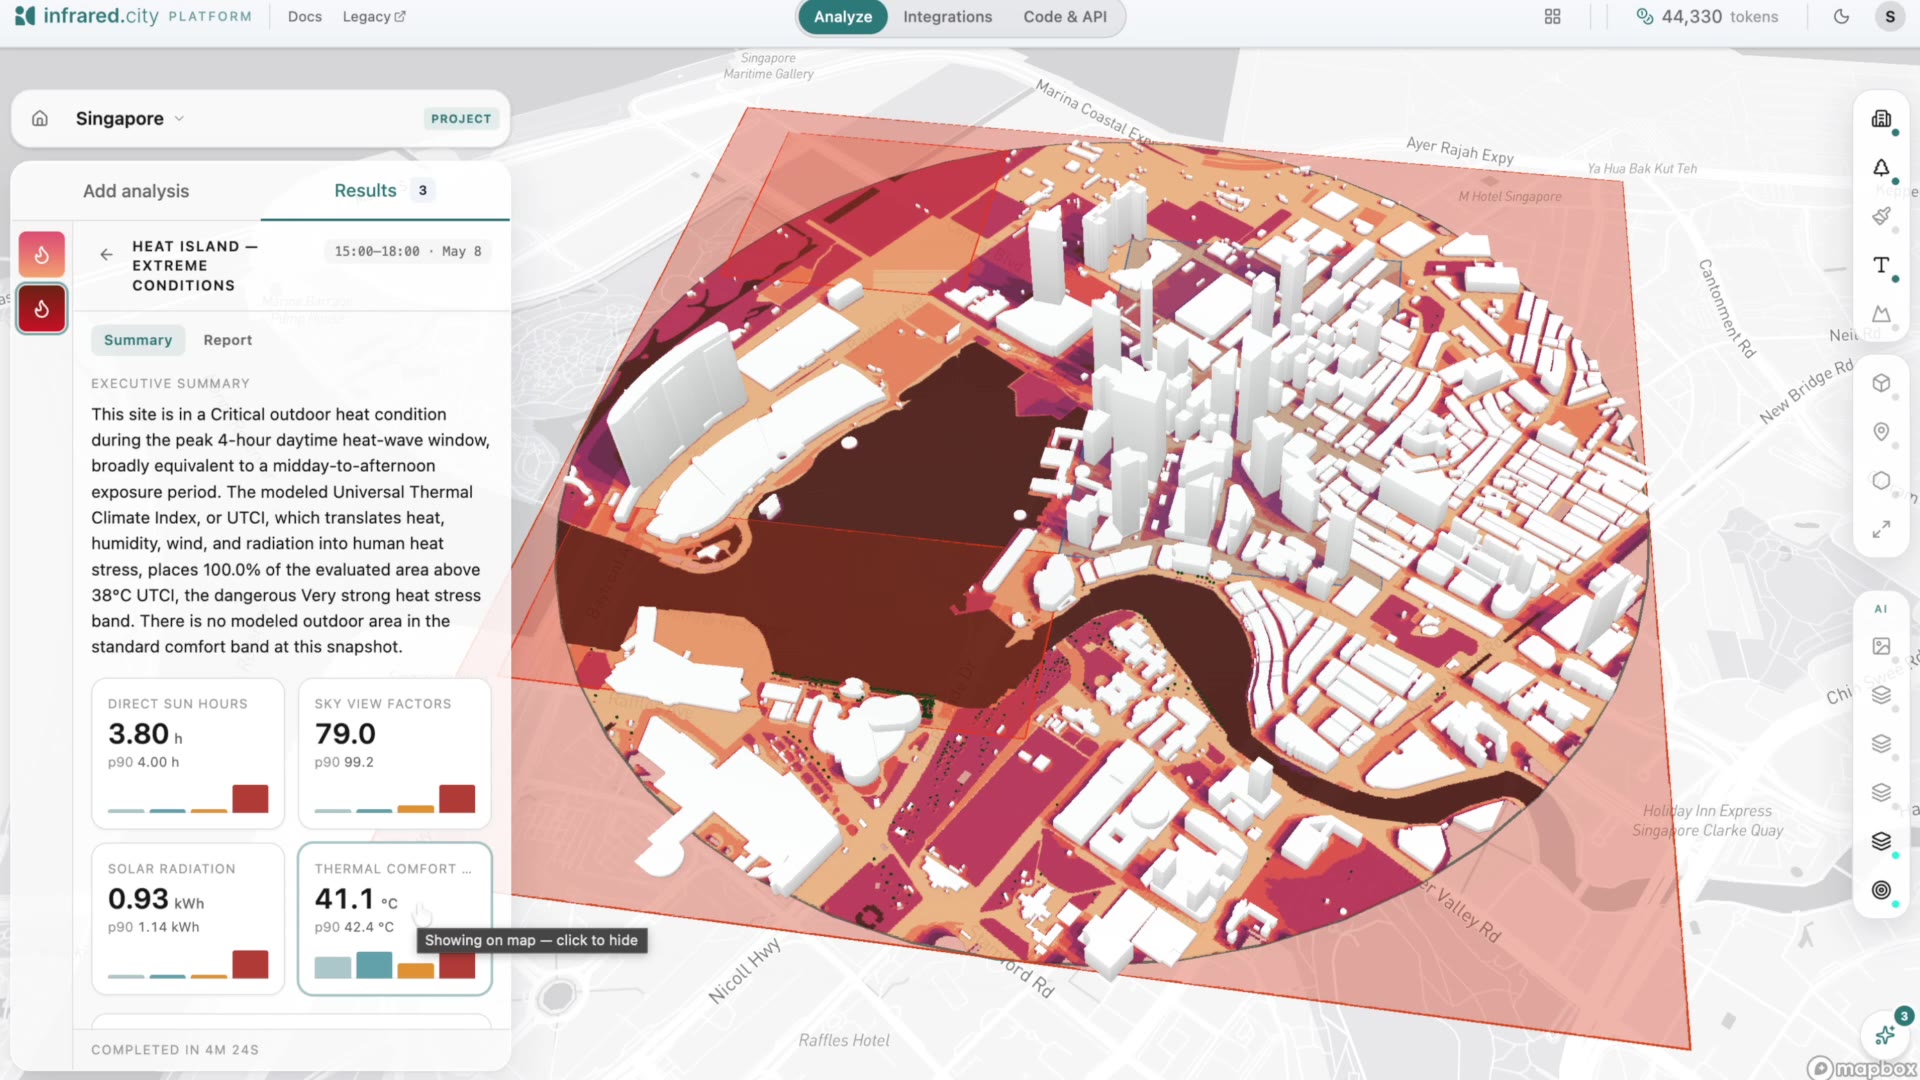
- Per-metric fields: sun hours, sky view factor, solar radiation, UTCI, directional wind
- Hotspots ranked by severity & share of site area
Let the AI site assistant do the work
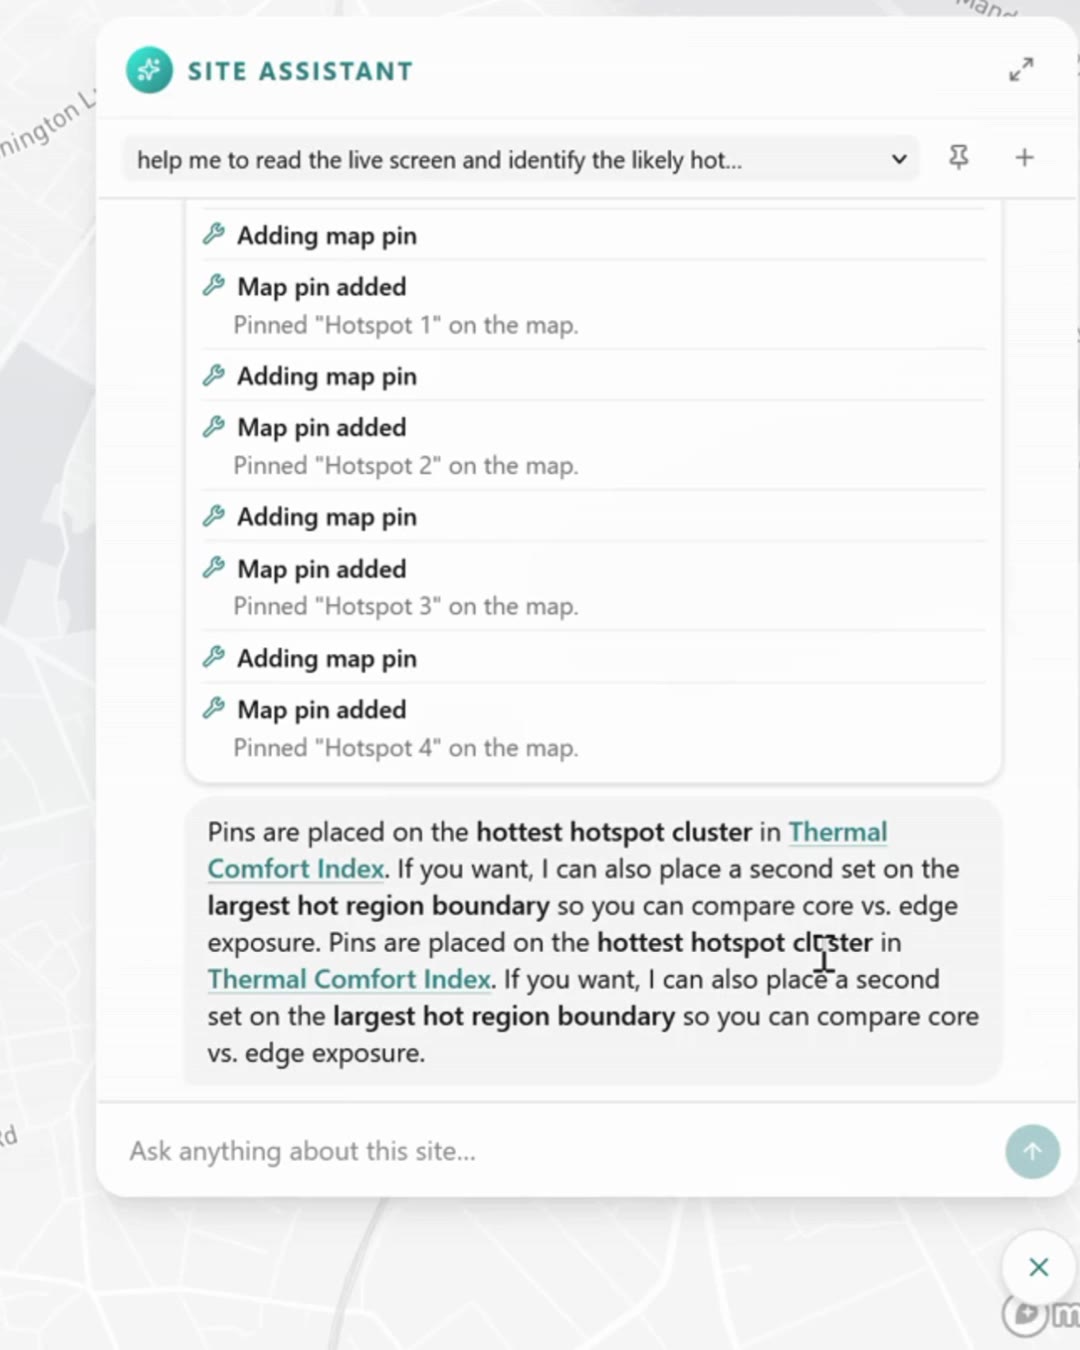
Ask in plain language — it works right inside your project.
- Edits your scene on screen
- Runs workflows for you
- Interprets results in plain language
- Recommends what to analyse next
Drops into the tools you already run
The same validated models, wherever you work.
- Grasshopper / Rhino, Revit, QGIS & ArcGIS
- Python SDK, REST API & MCP server
- Agent skills — Claude Code, Cursor, Windsurf & more
- Bring your own data
See It In Action
A 90-second preview — from a masterplan model to a combined microclimate report.
Masterplan microclimate analysis — UTCI heat stress, wind, and solar in one pass
Who This Webinar Is For
Urban planners & masterplanners
Working at district and city scale, where one metric is never the whole answer.
City authorities & municipal teams
Running climate adaptation, heat action plans, and public-realm diagnostics.
Consultants & engineers
Who need validated environmental feedback across a whole site, fast.
Developers & technical teams
Who want to call climate simulations directly from their own tools.
Leave ready to run your own analyses
A live run from city block to ranked hotspots in minutes — and a clear read on how outputs map to decisions.
- A live run: from city block to ranked hotspots in minutes
- How each output maps to design & planning decisions
- Direct insight into the SDK and API
- €90 in free credits to start — for everyone who signs up
Reserve Your Spot
30 July 2026 · 13:00–14:30 CET · Online — free to join, €90 in credits for everyone who registers