infrared.city for GIS
Run climate simulations directly in QGIS and ArcGIS — no export, no switching tools.
- 2
- GIS platforms supported
- 8
- Microclimate simulation models
- 2 s
- Simulation results per tile
- 1 m
- Grid resolution
The GIS Climate Simulation Gap
| Feature | Without infrared.city | With infrared.city |
|---|---|---|
| Running climate simulations from GIS data today means 4 manual steps. The infrared.city plugin collapses them all into one. | ||
| Source meteorological data | Manual | |
| CRS alignment | Manual | |
| Preprocess inputs | Manual | |
| Configure simulation | Manual | |
| Time to results | Hours of setup | Ready in minutes |
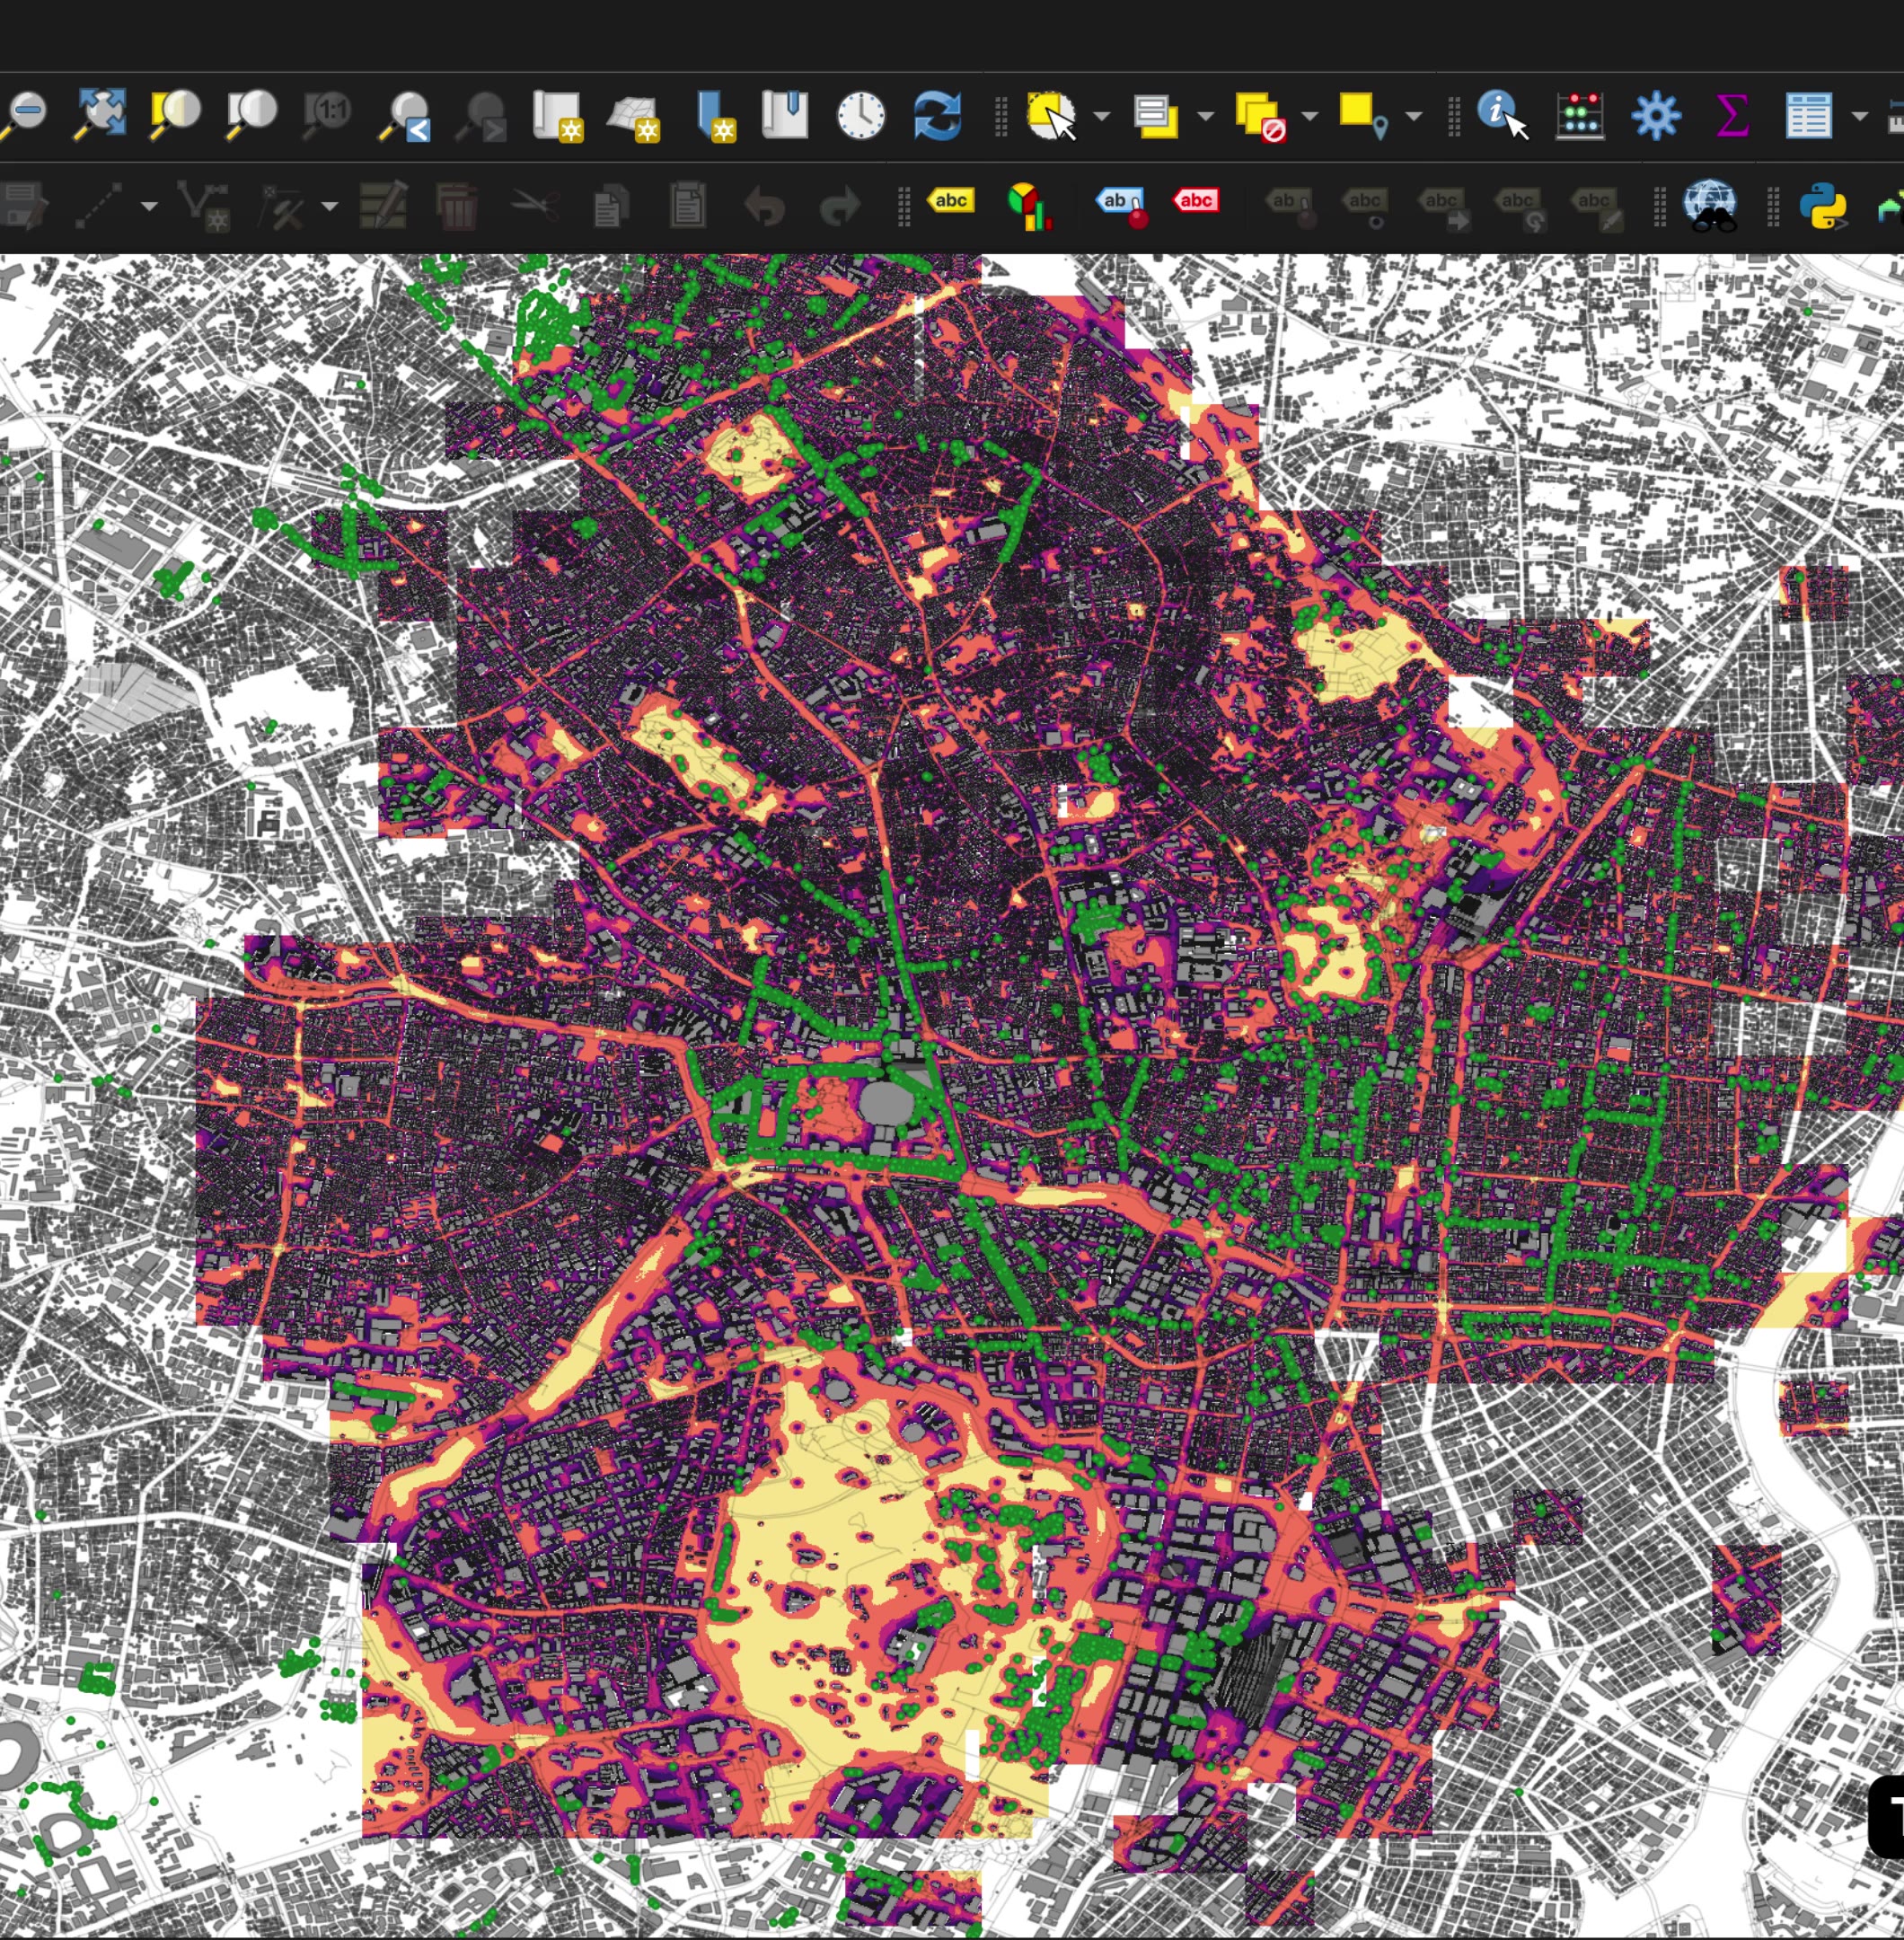
Native QGIS Plugin
Simulate wind comfort, solar radiation, and urban heat directly from your QGIS workspace. No file exports, no context switching — just results layered on top of your existing geodata.
- Wind speed
- Pedestrian wind comfort
- UTCI thermal comfort
- Heat stress & cold stress
- Solar radiation
- Daylight availability
- Sky view factor
- Direct sun hours
ArcGIS Integration
Connect infrared.city’s simulation engine to your ArcGIS workflows and spatial data. Analyse pedestrian-level climate conditions at the scale of entire neighbourhoods.
- infrared.city support
- All 8 simulation models available
- Esri-compatible output layers
- Simulation across large areas
- Vegetation handling in thermal simulation
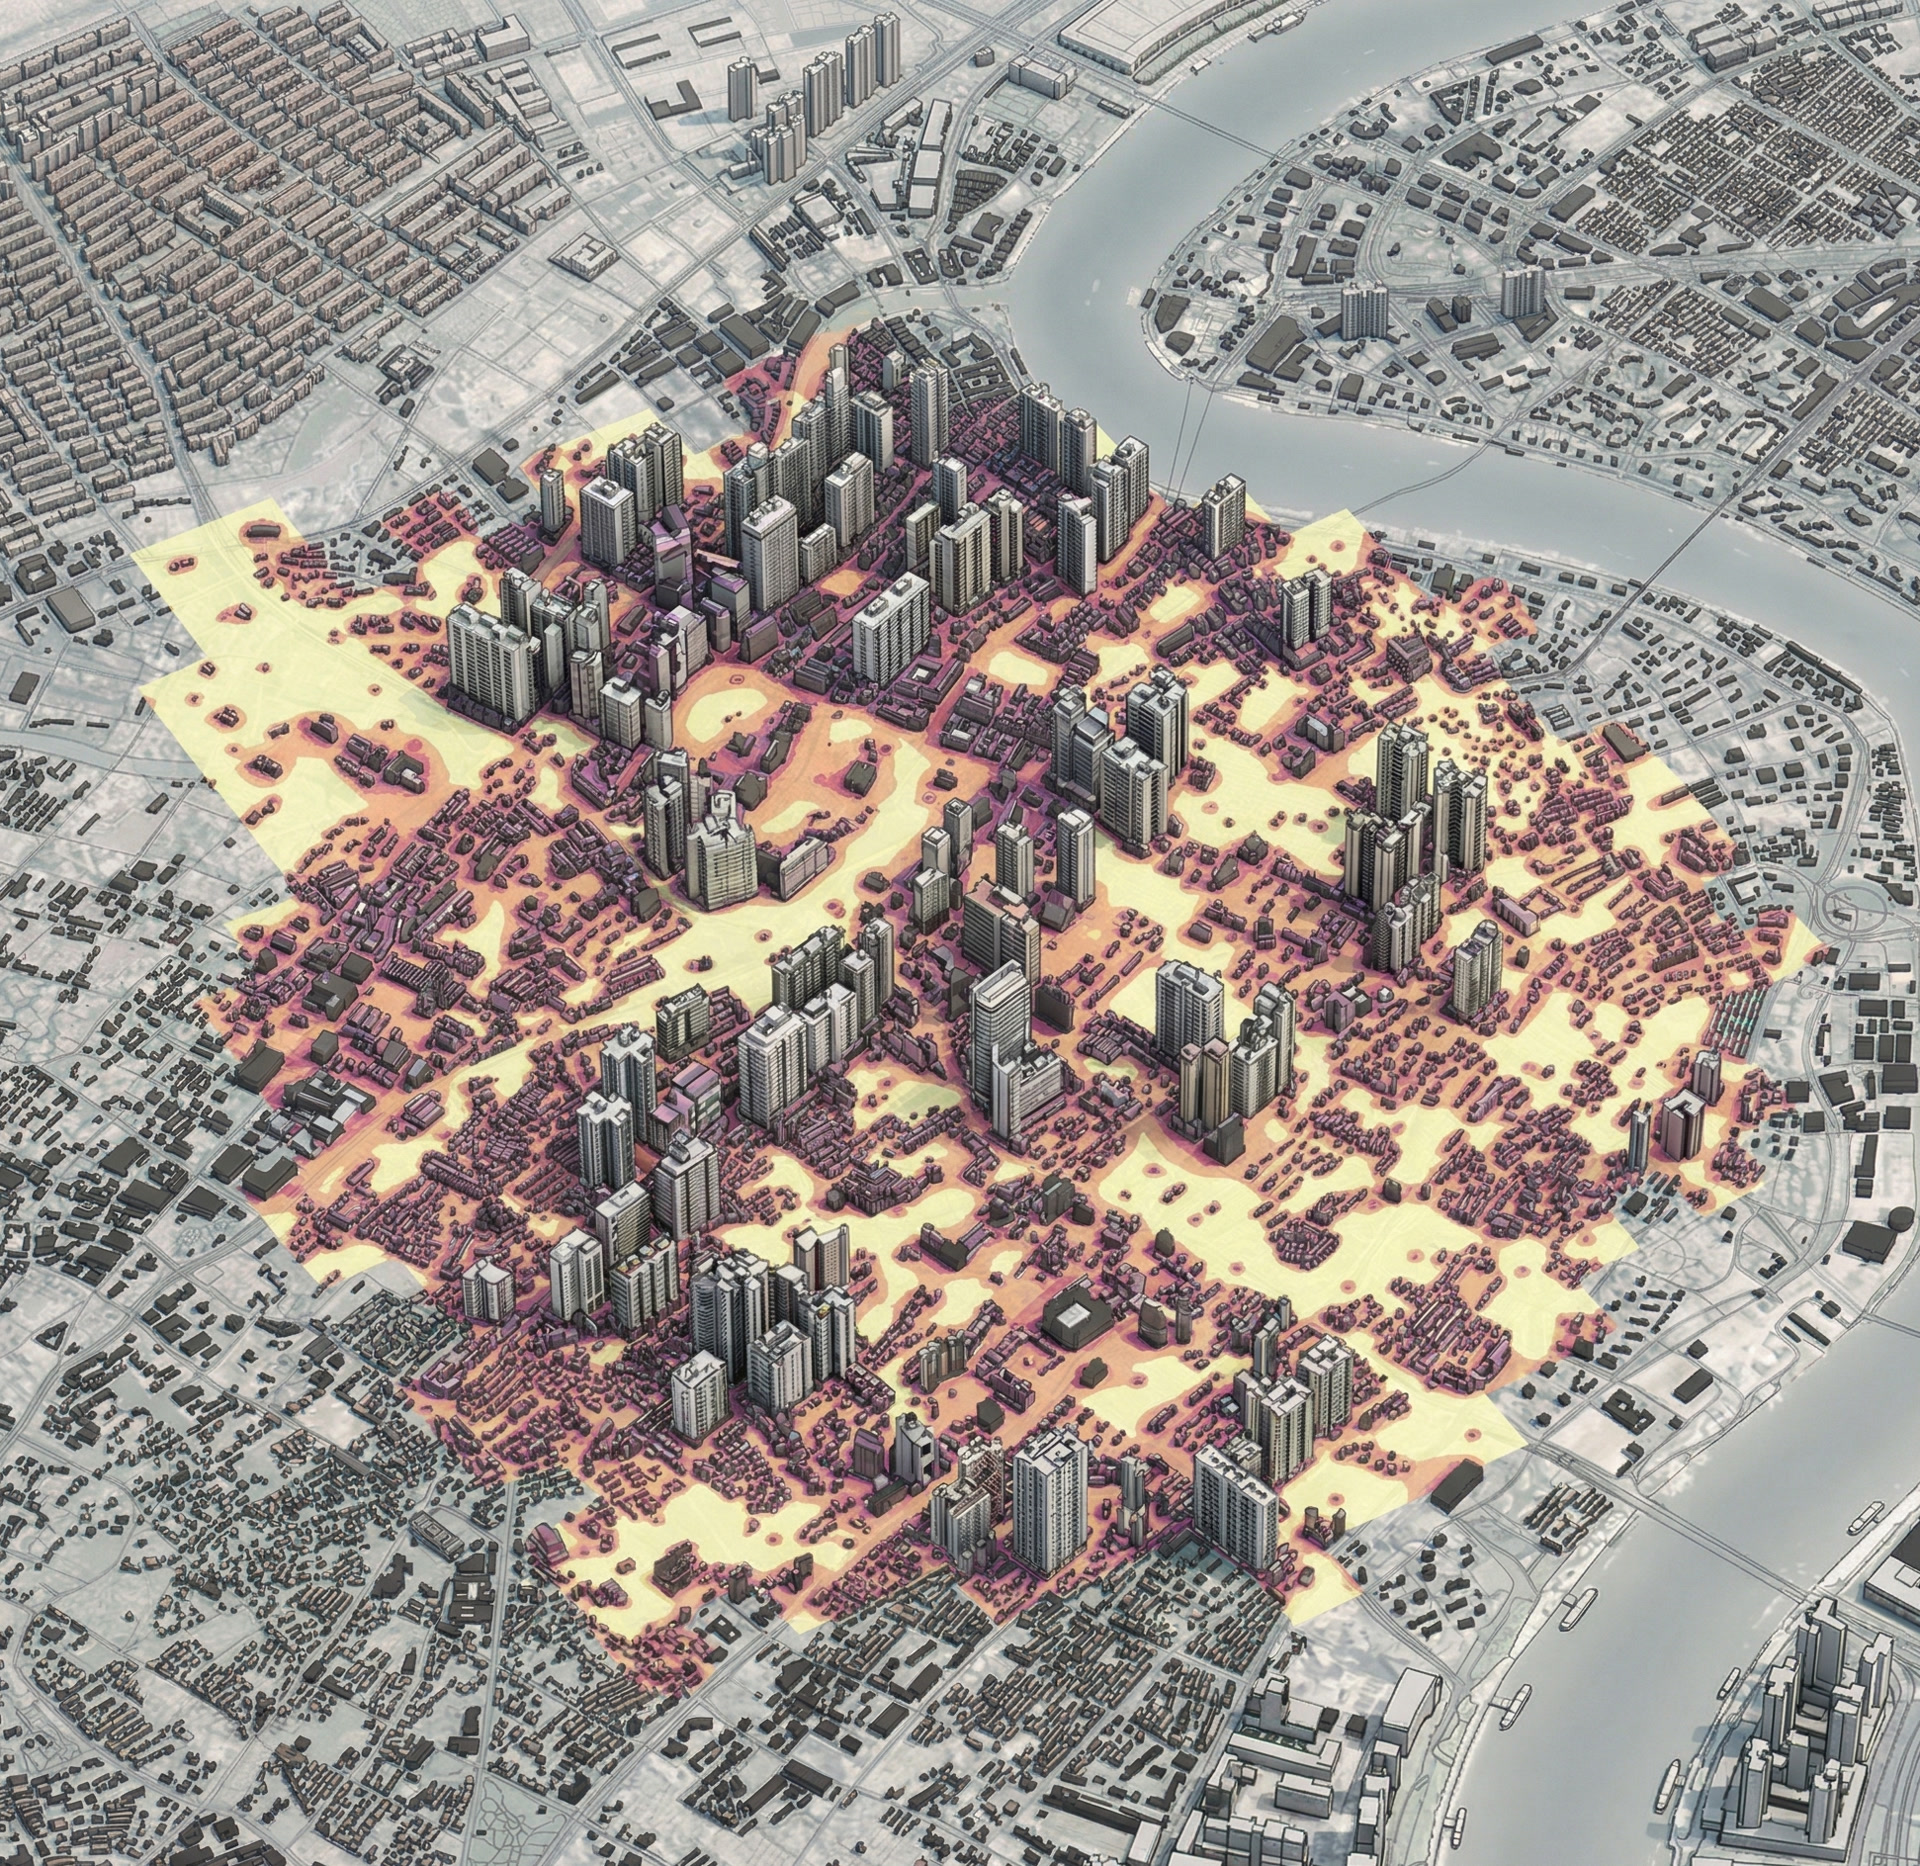
City-Scale Precision
-
Define Area
Select your city zone or district directly in QGIS or ArcGIS
-
Configure
Set simulation type, wind directions, and resolution — all from the plugin panel
-
Tile & Process
infrared.city splits the area into tiles and runs simulations in parallel across the city
-
Get Results
Climate layers delivered directly into your GIS workspace, ready to analyse
Sign Up to Webinar
Live demo — watch infrared.city’s GIS plugin in action